Summarize:
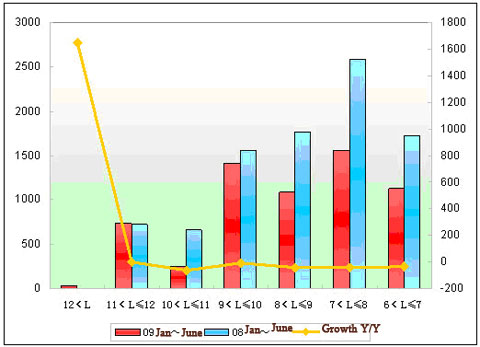
Sale growth analysis on every length bus
|
|
Total
|
12<L
|
11<L≤12
|
10<L≤11
|
9<L≤10
|
8<L≤9
|
7<L≤8
|
6<L≤7
|
5<L≤6
|
3.5<L≤5
|
|
2009
Jan~June
|
6210
|
35
|
734
|
245
|
1414
|
1091
|
1565
|
1126
|
|
|
|
2008
Jan~June
|
9023
|
2
|
720
|
660
|
1566
|
1765
|
2586
|
1724
|
|
|
|
Growth Y/Y
|
-31.18
|
1650
|
1.94
|
-62.9
|
-9.7
|
-38.2
|
-39.5
|
-34.7
|
|
|
|
Industry Growth
|
-33.65
|
-59.83
|
-38.53
|
-23.84
|
-34.24
|
-28.5
|
-42.2
|
-26.86
|
-28.38
|
-33.17
|

Conclusion from the table: 2009 Higer Jan ~ June sales are 31.18 percent reduction, which is higher than the industry nearly 2.5 percentage points, but the super-sized bus increased by 16.5 times, 11 to 12 meters bus increased by 1.94%, less than 40.5% of the industry reduction of nearly 38.53 percentage points. These show that the product structure of Higer is reasonable, under the situation of the general decline in the industry can have such a structure is really commendable. Higer is catching-up the top of industry.
