Summarize:2. Sale Volume of Yutong
B. Seating Bus
|
|
Total
|
12<L
|
11<L≤12
|
10<L≤11
|
9<L≤10
|
8<L≤9
|
7<L≤8
|
6<L≤7
|
|
2009 Jan-Aug
|
11534
|
42
|
2036
|
1498
|
493
|
1924
|
3353
|
2188
|
|
2008 Jan-Aug
|
13530
|
107
|
2744
|
1729
|
368
|
1976
|
4367
|
2239
|
|
Ratio
|
-14.8
|
-60.7
|
-25.8
|
-13.4
|
34.0
|
-2.6
|
-23.3
|
-2.3
|
|
Industrial Ratio
|
-20.0
|
26.4
|
-22.5
|
-34.1
|
-27.6
|
-17.2
|
-25.2
|
-14.8
|

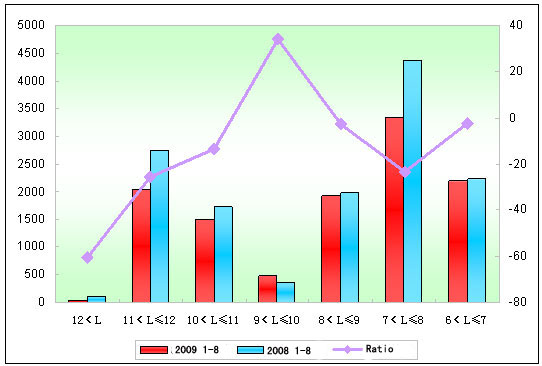
Remark: Compared the same period of last year, the sale in Jan – Aug this year is down 14.8%. Only 9~10m bus has increase with 34%. The most impacted sector is large-size bus and it is down 60.7%.
C. Inner City Bus
|
|
Total
|
12<L
|
11<L≤12
|
10<L≤11
|
9<L≤10
|
8<L≤9
|
7<L≤8
|
|
2009 Jan-Aug
|
3091
|
89
|
1021
|
425
|
424
|
492
|
640
|
|
2008 Jan-Aug
|
4123
|
79
|
1697
|
758
|
157
|
563
|
869
|
|
Ratio
|
-25.0
|
12.7
|
-39.8
|
-43.9
|
170.1
|
-12.6
|
-26.4
|
|
Industrial Ratio
|
-23.9
|
-75.5
|
-40.0
|
-9.7
|
-9.3
|
-21.7
|
-34.2
|

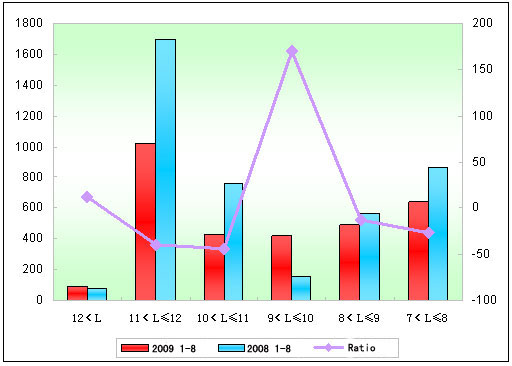
Remark: Compared the same period of last year, the sale in Jan – Aug this year is down 25%. Among them, 11~12m bus decreases 676 units, down 39.8%. 12<L bus increases 10 units, up 12.7%. 9~10m bus also increases, up 170.1%.
D. Sleeper Bus
|
|
Total
|
12<L
|
11<L≤12
|
10<L≤11
|
|
2009 Jan-Aug
|
839
|
34
|
805
|
1
|
|
2008 Jan-Aug
|
807
|
47
|
760
|
0
|
|
Ratio
|
4.0
|
-27.7
|
5.9
|
100
|
|
Industrial Ratio
|
-7.1
|
50.4
|
-11.7
|
-14.3
|
Remark: From the above list shows that Yutong’s sleeper bus holds the top place in China sleeper bus industry. From Jan to Aug in 2009, the sales volume of Yutong reaches 839 units and holding more than half of market share in China. Yutong gains profits from this sector to offset its whole sales downturn.
