Summarize:
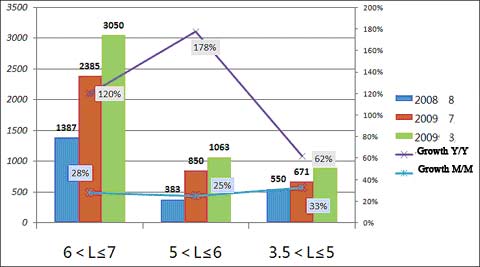
2009 August mini-bus sales table in every length range
|
|
6<L≤7
|
5<L≤6
|
3.5<L≤5
|
|
2009
August
|
Sales volume
|
Growth Y/Y
|
Growth M/M
|
Sales volume
|
Growth Y/Y
|
Growth M/M
|
Sales volume
|
Growth Y/Y
|
Growth M/M
|
|
3050
|
120%
|
28%
|
1063
|
178%
|
25%
|
891
|
62%
|
33%
|

2009 August mini-bus sales statistic chart in every length range
First, August 2009, 3.5<L≤5M bus totally sold 891 units,comparing with the last month, an increase of 33% m/m,comparing with the same period of last year, grow 62%. In this length, Golden Dragon continuously contribute more. But while the new policy has stimulated the demand for mini-buses this year, but the mini-bus has also been weighed on their needs by a number of non-standard market and other factors, coupled with the impact of the financial crisis in overseas markets, so at the same time of definitely start warming, we need to wait for further market outlook.
Second, August 2009 5 <L ≤ 6 M bus total sold 1063 units, comparing with the last month, an increase of 25% m/m,comparing with the same period of last year, grow 178%. In the length of the segment over the first half of year have consecutive four months of positive growth. In the past two years were relatively weak, but in the case of the market generally gloomy, but achieve growth firstly, which is primarily caused by national low-emission policy and internal demand for constant positive periodic warming persistent efforts this month.
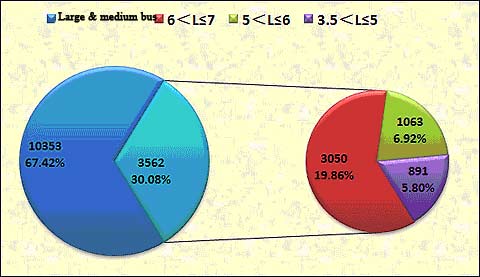
Mini-bus market share analysis
2009 August Mini-bus market share ratio table
|
|
Total bus
|
Total mini-bus
|
6<L≤7
|
5<L≤6
|
3.5<L≤5
|
|
Sales volume
|
15357
|
5004
|
3050
|
1063
|
891
|
|
Ratio in total bus
|
100%
|
32.6%
|
19.9%
|
6.9%
|
5.8%
|
|
Ratio in mini-bus
|
--
|
100%
|
61.0%
|
21.2%
|
17.8%
|

2009 August Mini-bus market share ratio table
We see mini-buses’ sale take 30% of total bus sale, and is basically the same as last year. In mini-bus, 6 <L ≤ 7 M sold the most, accounting for 20% of bus, increased by 1% over the previous period, accounting for 61% of small passenger cars; 5 <L ≤ 6 M sale is second, accounting for 7% of bus, accounting for 21% of small passenger cars, compared to the previous reducing 1%; 3.5 <L ≤ 5 M segment sales only accounting for 6% of bus, increased by 1% over the previous period, small passenger cars accounted for 18% increase over the previous period by 1%.
