Summarize:
2008 January to 2009 August large-bus sales volume statistic table
|
Year
|
Month
|
12<L
|
11<L≤12
|
10<L≤11
|
Total
|
|
2008
|
January
|
433
|
3710
|
1817
|
5960
|
|
February
|
212
|
1252
|
825
|
2289
|
|
March
|
397
|
2086
|
1515
|
3998
|
|
April
|
328
|
2959
|
1724
|
5011
|
|
May
|
375
|
2798
|
2040
|
5213
|
|
June
|
488
|
3832
|
3435
|
7755
|
|
July
|
316
|
2309
|
2634
|
5259
|
|
August
|
89
|
2588
|
1683
|
4360
|
|
September
|
166
|
2408
|
2283
|
4857
|
|
October
|
103
|
1892
|
1394
|
3389
|
|
November
|
127
|
1937
|
1926
|
3990
|
|
December
|
293
|
3246
|
2192
|
5731
|
|
2009
|
January
|
167
|
1529
|
1182
|
2878
|
|
February
|
73
|
771
|
1006
|
1850
|
|
March
|
186
|
1447
|
1157
|
2790
|
|
April
|
95
|
2106
|
1538
|
3739
|
|
May
|
243
|
2081
|
1498
|
3822
|
|
June
|
133
|
2292
|
2268
|
4693
|
|
July
|
63
|
2079
|
1799
|
3941
|
|
August
|
180
|
2814
|
1953
|
4947
|

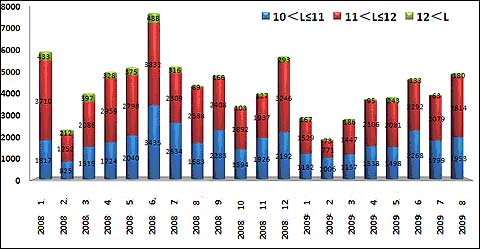
2008 January to 2009 August large-bus sales volume statistic chart
The overall change trend of mini-bus and the season fluctuate is very close to the bus industry, both based on July 2008 the development trend as the turning point and the sales volume in February was obvious low.
Large-bus growth analysis
2009 August large-bus sales volume growth ratio table
|
|
Bus
|
Large-Bus
|
|
2009
August
|
Sales volume
|
Growth Y/Y
|
Growth M/M
|
sales volume
|
Growth Y/Y
|
Growth M/M
|
|
15357
|
43%
|
22%
|
4947
|
13%
|
26%
|

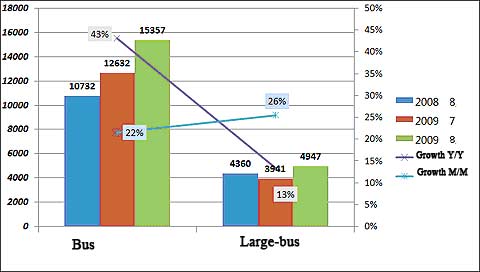
2009 August large-bus sales volume growth ratio chart
Large-bus sold 15357 units in August 2009, comparing with the last month, an increase of 22% m/m, comparing with the same period of last year, rise 43% y/y. Related to orders, performance, evaluation, marketing season, such as seasonal reasons, sales volume has significant growth compared to last month.
