Summarize:English.chinabuses.com: Part 1 Analysis of sales increase in bus industry between Jan-Aug 2009 and Jan-Aug 2008
1. Overall sales increase in each length
|
|
Total
|
12<L
|
11<L≤12
|
10<L≤11
|
9<L≤10
|
8<L≤9
|
7<L≤8
|
6<L≤7
|
5<L≤6
|
3.5<L≤5
|
|
Jan-Aug 2009
|
89636
|
1140
|
15119
|
12401
|
6815
|
11648
|
15246
|
15890
|
6236
|
5141
|
|
Jan-Aug 2008
|
113938
|
2638
|
21534
|
15673
|
8454
|
14374
|
21258
|
16776
|
6979
|
6252
|
|
Year on year increase
|
-21.3
|
-56.8
|
-29.8
|
-20.9
|
-19.4
|
-19.0
|
-28.3
|
-5.3
|
-10.6
|
-17.8
|

It can be observed that:
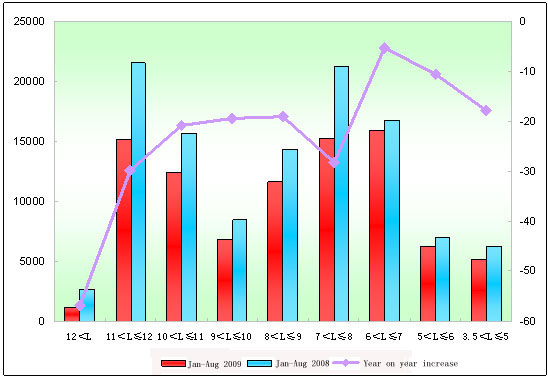
Sales volume drops 21.3% YoY in first eight months this year, and it is an overall decline since Jan -45.9%, Feb -41.5%, March -34.2%, April -32.7%, May -32.2%, June -33.65%, July -28.03% and Aug -21.3%. It shows that financial crisis is still influencing bus market, but the decline amplitude became smaller than previous months, namely smaller than 25% for the first time, indicating the recovery period is peeping. Super large buses which are over 12-meter long saw the biggest decline -56.8%, then it comes 11~12-meter -29.8%, 7~8-meter -28.3%, 6~7-meter -5.3% (the smallest decline), 5~6-meter -10.6%, and 3.5~5-meter -17.8%.
2. Coach
|
|
Total
|
12<L
|
11<L≤12
|
10<L≤11
|
9<L≤10
|
8<L≤9
|
7<L≤8
|
6<L≤7
|
5<L≤6
|
3.5<L≤5
|
|
Jan-Aug 2009
|
57981
|
416
|
7711
|
4727
|
2842
|
6620
|
10905
|
13618
|
6001
|
5141
|
|
Jan-Aug 2008
|
72499
|
329
|
9949
|
7177
|
3927
|
7996
|
14586
|
15986
|
6303
|
6252
|
|
Year on year increase
|
-20.0
|
26.4
|
-22.5
|
-34.1
|
-27.6
|
-17.2
|
-25.2
|
-14.8
|
-4.8
|
-17.8
|
It can be observed that:
Sales volume drops 20.0% for coaches in the first eight months this year, which is slightly smaller than overall bus market; only super large buses saw increase, indicating that super large coaches are still increasing, but the base is not large. Ten-eleven-meter buses saw the biggest decline, then it comes 9~10-meter, 7~8-meter, 6~7-meter, and 5~6-metre saw the smallest decline. It shows the decline of coaches contributes the main part of the overall decline in the first eight months decline in 2009 and financial crisis posed huge influence on the coaches market in this period.
3. Public transport buses
|
|
Total
|
12<L
|
11<L≤12
|
10<L≤11
|
9<L≤10
|
8<L≤9
|
7<L≤8
|
6<L≤7
|
5<L≤6
|
|
Jan-Aug 2009
|
29896
|
529
|
5977
|
7662
|
3970
|
4995
|
4340
|
2161
|
235
|
|
Jan-Aug 2008
|
39290
|
2160
|
9965
|
8482
|
4376
|
6376
|
6599
|
682
|
650
|
|
Year on year increase
|
-23.9
|
-75.5
|
-40.0
|
-9.7
|
-9.3
|
-21.7
|
-34.2
|
216.9
|
-63.8
|
It is observed that:
Sales volume drops 23.9% for public transport buses in first eight months this year, nearly 7% less than the first seven months, and this is also the seventh decline of public transport buses market since last year, indicating that public transport bus market was influenced by financial crisis and it also contributes the main reason of the overall decline of the public transport bus market. It can be seen that only 6~7-meter buses increased, up to 216.9%, indicating that countryside public transport bus market started to increase. Super large buses saw the biggest decline, up to 75.5%, then it comes 5~6-meter -63.8%, 11~12-meter -40%.
4. Sleeper bus
|
|
Total
|
12<L
|
11<L≤12
|
10<L≤11
|
|
Jan-Aug 2009
|
1637
|
194
|
1431
|
12
|
|
Jan-Aug 2008
|
1763
|
129
|
1620
|
14
|
|
Year on year increase
|
-7.1
|
50.4
|
-11.7
|
-14.3
|
It can be observed that:
Sleeper buses saw overall decline in the first eight months 2009 YoY. The decline amplitude is up to 7.1%, nearly 3% less than the first seven months (9.91%). The 11~12-meter buses, main products of sleeper bus, saw the biggest decline, up to 189 vehicles. It is also noted that the decline amplitude of sleeper bus is less than coaches and public transport buses, and sleeper bus is also least influenced in bus market.
Part 2 Top 20 sales volume of bus manufacturers in the first eight months 2009 compared with the same period in 2008
|
Rank
|
Manufacturer
|
Jan-Aug 2009
|
Jan-Aug 2008
|
Amplitude increased
|
|
1
|
Yutong
|
15464
|
18480
|
-16.3
|
|
2
|
Golden Dragon
|
9048
|
11559
|
-21.7
|
|
3
|
Higer
|
8894
|
11233
|
-20.8
|
|
4
|
King Long
|
7964
|
9652
|
-17.5
|
|
5
|
Shaolin
|
4427
|
4860
|
-8.9
|
|
6
|
Zhongtong
|
4289
|
5455
|
-21.4
|
|
7
|
Hengtong
|
2688
|
2569
|
4.6
|
|
8
|
Youyi
|
2445
|
3053
|
-19.9
|
|
9
|
Changan
|
2342
|
2600
|
-9.9
|
|
10
|
JAC
|
2328
|
3757
|
-38
|
|
11
|
Guilin Bus
|
1872
|
1748
|
7.1
|
|
12
|
Huanghai
|
1798
|
3422
|
-47.5
|
|
13
|
Yangtse
|
1784
|
1956
|
-8.8
|
|
14
|
Shenlong
|
1664
|
2017
|
-17.5
|
|
15
|
Foton
|
1579
|
1689
|
-6.5
|
|
16
|
Sunwin
|
1547
|
2152
|
-28.1
|
|
17
|
Yaxing
|
1459
|
2360
|
-38.2
|
|
18
|
NAVECO
|
1454
|
2049
|
-29
|
|
19
|
Ankai
|
1400
|
2189
|
-36
|
|
20
|
Youngman
|
1355
|
1298
|
4.4
|
|
|
Bus Industry
|
89636
|
113938
|
-21.3
|

