Summarize:
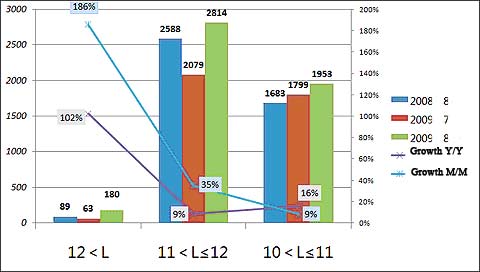
2009 August large-bus sales table in every length range
|
|
12<L
|
11<L≤12
|
10<L≤11
|
|
2009
August
|
Sales volume
|
Growth Y/Y
|
Growth M/M
|
Sales volume
|
Growth Y/Y
|
Growth M/M
|
Sales volume
|
Growth Y/Y
|
Growth M/M
|
|
180
|
102%
|
186%
|
2814
|
9%
|
35%
|
1953
|
16%
|
9%
|

2009 August large-bus sales statistic chart in every length range
First, August 2009, 10<L≤11M bus totally sold 1953 units,comparing with the last month, an increase of 9% m/m,comparing with the same period of last year, grow 16%. In this length, the market demand is currently rather vague, the data is impacted greatly by last year's performance is showing a weak law, but the growth is relatively stable in this month, the substitution effect of medium-sized bus are clear.
Second, August 2009, 11<L ≤ 12 M bus total sold 2814 units, comparing with the last month, an increase of 35% m/m,comparing with the same period of last year, grow 9%. The length of large-bus is a the key length to represent large-bus production levels, technological strength and profitability, its market demand in the past two years have demonstrated strong performance in the first half of this year, but the first half year is general, the next half year rebound faster.
Large-bus market share analysis
2009 August large-bus market share ratio table
|
|
Total bus
|
Total large-bus
|
12<L
|
11<L≤12
|
10<L≤11
|
|
Sales volume
|
15357
|
4947
|
180
|
2814
|
1953
|
|
Ratio in total bus
|
100%
|
32.2%
|
1.2%
|
18.3%
|
12.7%
|
|
Ratio in mini-bus
|
--
|
100%
|
3.6%
|
56.9%
|
39.5%
|

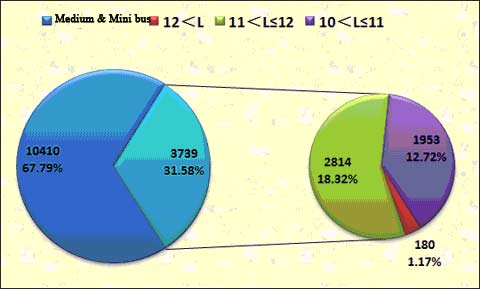
2009 August large-bus market share ratio chart
We see large-bus sale take 32% of total bus sale, and is basically the same as last year. In large-bus, 10<L ≤ 11 M sold the most, accounting for 13% of bus, decreased by 3% over the previous period, accounting for 40% of large-bus; 11 <L ≤ 12M sale is the most, accounting for 18% of total bus, increase 12% compared to the previous month;
