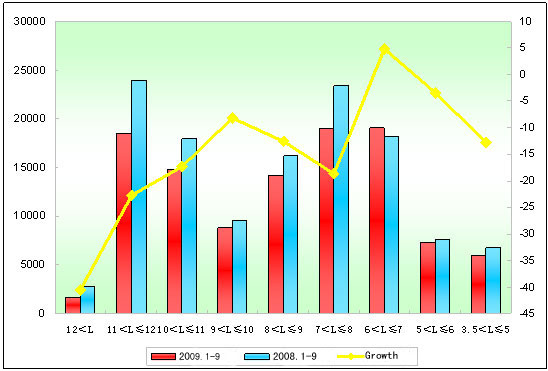
Summarize:1. Sales Growth Analysis in Length (2009.1-9 & 2008.1-9)
|
|
Total
|
12<L
|
11<L≤12
|
10<L≤11
|
9<L≤10
|
|
2009.1~9
|
109266
|
1666
|
18481
|
14857
|
8754
|
|
2008.1~9
|
126373
|
2804
|
23942
|
17956
|
9523
|
|
Growth
|
-13.54
|
-40.58
|
-22.81
|
-17.26
|
-8.08
|
| |
8<L≤9
|
7<L≤8
|
6<L≤7
|
5<L≤6
|
3.5<L≤5
|
|
2009.1~9
|
14179
|
19007
|
19107
|
7321
|
5894
|
|
2008.1~9
|
16208
|
23387
|
18227
|
7574
|
6752
|
|
Growth
|
-12.52
|
-18.73
|
4.83
|
-3.34
|
-12.71
|

Chart for Sales Growth Analysis in Length
Remark: Compared the same period of the last year, the sale decreases 13.54 percent. The sales performance of 12<L bus decreases 40.58 percent. This sector is badly impacted by the global financial crisis. It also shows that the global financial crisis is lingering.
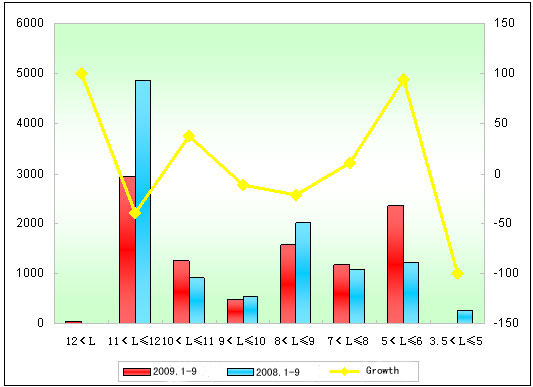
2. Sales Growth Analysis in Length of China Buses Industry and Kinglong (2009.1-9 & 2008.1-9)
|
|
Total
|
12<L
|
11<L≤12
|
10<L≤11
|
9<L≤10
|
|
2009.1~9
|
9846
|
40
|
2949
|
1253
|
485
|
|
2008.1~9
|
10880
|
0
|
4870
|
913
|
546
|
|
Growth
|
-9.5
|
100
|
-39.4
|
37.2
|
-11.2
|
|
Industrial Growth
|
-13.54
|
-40.58
|
-22.81
|
-17.26
|
-8.08
|
| |
8<L≤9
|
7<L≤8
|
6<L≤7
|
5<L≤6
|
3.5<L≤5
|
|
2009.1~9
|
1582
|
1175
|
0
|
2362
|
0
|
|
2008.1~9
|
2018
|
1067
|
0
|
1216
|
250
|
|
Growth
|
-21.6
|
10.1
|
0
|
94.2
|
-100
|
|
Industrial Growth
|
-12.52
|
-18.73
|
4.83
|
-3.34
|
-12.71
|

Chart for Sales Growth Analysis in Length of China Buses Industry and Kinglong
Remark: Compared the same period of the last year, the sales volume of Kinglong decreases 1034 untis, down 9.5 percent. However, the sales volume of Kinglong is better than the whole industry performance. The sale of 5<L≤6 bus sector is excellent, up 94.2 percent year-on-year. All in all, the market performance of Kinglong places the second position in this time.
3. Sales Growth Analysis for Seat Bus
|
|
Total
|
12<L
|
11<L≤12
|
10<L≤11
|
9<L≤10
|
|
2009.1~9
|
69991
|
496
|
9402
|
5566
|
3652
|
|
2008.1~9
|
79359
|
374
|
10997
|
8043
|
4236
|
|
Growth
|
-11.8
|
32.6
|
-14.5
|
-30.8
|
-13.8
|
| |
8<L≤9
|
7<L≤8
|
6<L≤7
|
5<L≤6
|
3.5<L≤5
|
|
2009.1~9
|
8015
|
13533
|
16372
|
7061
|
5894
|
|
2008.1~9
|
8982
|
15829
|
17283
|
6863
|
6752
|
|
Growth
|
-10.8
|
-14.5
|
-5.3
|
2.9
|
-12.7
|
Remark: The form shows that the sale performance of seat bus is not very good. Compared the same period of the last year, the sales growth is down 11.8 percent. The seat bus business is badly impacted by the global financial turmoil in this year. However, the economic situation seems to touch bottom.
