Summarize:4. Sales Growth Analysis of Kinglong Seat Bus
|
|
Total
|
12<L
|
11<L≤12
|
10<L≤11
|
9<L≤10
|
|
2009.1~9
|
7551
|
40
|
1616
|
703
|
485
|
|
2008.1~9
|
8107
|
0
|
2778
|
507
|
546
|
|
Growth
|
-6.9
|
100
|
-41.8
|
38.7
|
-11.1
|
|
Industrial Growth
|
-11.8
|
32.6
|
-14.5
|
-30.8
|
-13.8
|
| |
8<L≤9
|
7<L≤8
|
6<L≤7
|
5<L≤6
|
3.5<L≤5
|
|
2009.1~9
|
1170
|
1175
|
0
|
2362
|
0
|
|
2008.1~9
|
1743
|
1067
|
0
|
1216
|
250
|
|
Growth
|
-32.9
|
10.1
|
0
|
94.2
|
-100
|
|
Industrial Growth
|
-10.8
|
-14.5
|
-5.3
|
2.9
|
-12.7
|

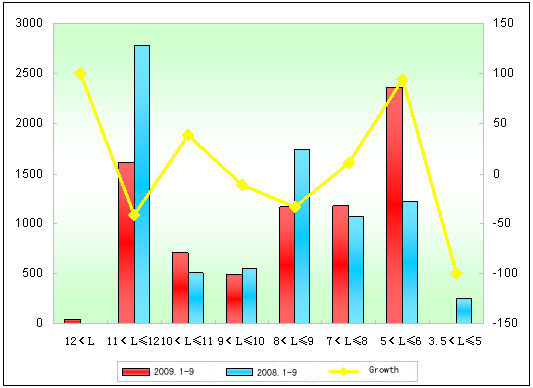
Chart for Sales Growth of Kinglong Seat Bus
Remark: The sales volume of Kinglong Seat Bus is down 6.9 percent year-on-year. The business of inner-city bus badly impacts the Kinglong' s whole sale. From the form also shows that the business of Kinglong large-sized bus increases and it sold total 40 units in September. The sales volume of Kinglong is better than the whole industry performance.
5. Sales Growth Analysis for Inner-city Bus
|
|
Total
|
12<L
|
11<L≤12
|
10<L≤11
|
9<L≤10
|
|
2009.1~9
|
37199
|
930
|
7424
|
9278
|
5098
|
|
2008.1~9
|
44562
|
2256
|
11057
|
9899
|
5129
|
|
Growth(YOY)
|
-16.5
|
-58.8
|
-32.9
|
-6.3
|
-0.60
|
| |
8<L≤9
|
7<L≤8
|
6<L≤7
|
5<L≤6
|
3.5<L≤5
|
|
2009.1~9
|
6131
|
5472
|
2606
|
260
|
|
|
2008.1~9
|
7224
|
7485
|
836
|
676
|
|
|
Growth(YOY)
|
-15.1
|
-26.9
|
211.7
|
-61.5
|
|
Remark: Compared the same period of the last year, the sales volume in this year is down 16.5 percent. Only 6<L≤7 sector has the positive growth. The global financial crisis and bad investor’s expectation lead the growth decrease. Among them, the sales performance of 12<L bus sector is badly impacted by the economic downturn and it is down 58.8 percent year-on-year.
6. Sales Growth Analysis of Kinglong Inner-city Bus
|
|
Total
|
11<L≤12
|
10<L≤11
|
8<L≤9
|
|
2009.1~9
|
2198
|
1238
|
550
|
410
|
|
2008.1~9
|
2773
|
2092
|
406
|
275
|
|
Growth
|
-20.7
|
-40.8
|
35.5
|
49.1
|
|
Industrial Growth
|
-16.5
|
-32.9
|
-6.3
|
-15.1
|

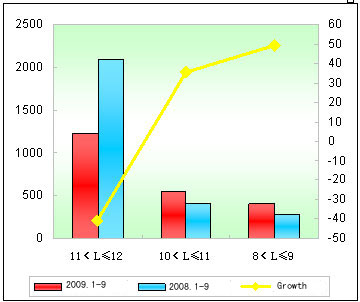
Chart for Sales Growth Analysis of Kinglong Inner-city Bus
Remark: From January to September, the sales volume of Kinglong is down 20.7 percent year-on-year and the whole industrial sale is down 16.5 percent. The worst sector is 11<L≤12 bus and it is down 40.8 percent year-on-year. It decrease nearly a half. The uncertain economic situation badly impacts the sales volume of Kinglong inner-city bus.
