Summarize:www.chinabuses.org:
Part 2 Analysis of sales streams and market concentration of 10-11meter public transport buses Jan.-Nov. 2009
According to research center of Chinabuses.com, the top fifteen regional markets where sales volumes of 10-11meter buses from January to November 2009 are as followings:
Table 3 Statistics of sales volumes of 10-11meter buses in top fifteen regional markets Jan.-Nov. 2009 (Units: vehicle )
|
Rank
|
Regions
|
Sales
|
Concentration %
|
Note
|
|
1
|
Guangdong
|
1072
|
9.7
|
Contain NG
|
|
2
|
Jiangsu
|
1028
|
9.3
|
Contain NG
|
|
3
|
Shandong
|
796
|
7.2
|
Contain NG
|
|
4
|
Henan
|
729
|
6.6
|
Contain NG
|
|
5
|
Shanghai
|
641
|
5.8
|
Contain NG
|
|
6
|
Sichuan
|
619
|
5.6
|
Contain NG
|
|
7
|
Beijing
|
573
|
5.2
|
Contain NG
|
|
8
|
Liaoning
|
542
|
4.9
|
Contain NG
|
|
9
|
Zhejiang
|
519
|
4.7
|
Contain NG
|
|
10
|
Fujian
|
475
|
4.3
|
Contain NG
|
|
11
|
Hubei
|
431
|
3.9
|
Contain NG
|
|
12
|
Hunan
|
376
|
3.4
|
Contain NG
|
|
13
|
Hebei
|
354
|
3.2
|
Contain NG
|
|
14
|
Guangxi
|
343
|
3.1
|
Contain NG
|
|
15
|
Chongqing
|
309
|
2.8
|
Contain NG
|
|
|
合计
|
8807
|
79.7
|
Contain NG
|

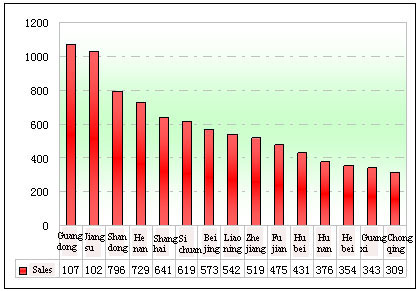
Figure 3 Statistics of sales volumes of 10-11meter buses in top fifteen regional markets Jan.-Nov. 2009
It can be seen from above that the biggest sales volumes area of 10-11meter city buses is in Guangdong, sales volumes is 1,072 units, and market concentration is 9.7%; then comes Jiangsu, 1,028, 9.3%, Shandong, 796, 7.2%. And sales volumes in Shanghai is the largest among cities, sales volumes is 641 units, and market concentration is 5.8%; then comes Beijing, 573, 5.2%; then Chongqing, 309, 2.8%. Market concentration of the top fifteen regional markets is 79.7% illustrating that sales of ten-eleven-meter buses was not well-distributed, but to above regions and cities, and this can be taken as guidance for bus builders on marketing strategies and resource allocation.
Part 3 Analysis of sales statistics of 10-11meter public transport buses Jan.-Nov. 2009
Table 4 Sales statistics of 10-11meter public transport buses by major bus builders Jan.-Nov. 2009
|
Rank
|
Bus Builders
|
Sales:Unit
|
Concentration %
|
Note
|
|
1
|
Hengtong
|
1525
|
13.8
|
Include 11 m, exclude 10 m
|
|
2
|
Sunwin
|
1251
|
11.3
|
Include 11 m, exclude 10 m
|
|
3
|
Dongfeng Yangtse
|
1080
|
9.8
|
Include 11 m, exclude 10 m
|
|
4
|
Huanghai
|
832
|
7.5
|
Include 11 m, exclude 10 m
|
|
5
|
Yutong
|
819
|
7.4
|
Include 11 m, exclude 10 m
|
|
6
|
King Long
|
649
|
5.9
|
Include 11 m, exclude 10 m
|
|
7
|
Guilin Bus
|
546
|
4.9
|
Include 11 m, exclude 10 m
|
|
8
|
Yaxing
|
468
|
4.2
|
Include 11 m, exclude 10 m
|
|
9
|
Ankai
|
448
|
4.1
|
Include 11 m, exclude 10 m
|
|
10
|
Zhongtong
|
440
|
4
|
Include 11 m, exclude 10 m
|
|
|
Total
|
8058
|
73
|
Include 11 m, exclude 10 m
|

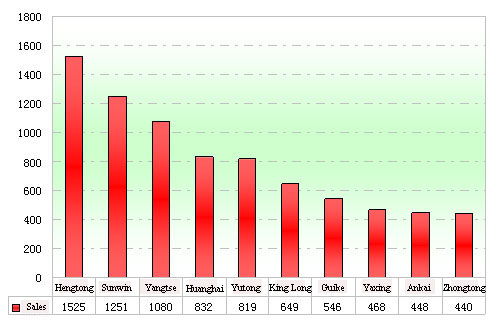
Figure 4 Sales statistics of ten-eleven-meter public transport buses by major bus builders Jan.-Nov. 2009
It can be seen that:
a. Chongqing Hengtong Bus sold the most such public transport buses, 1,525 vehicles were sold out, and market concentration is 13.8%, then comes Shanghai Sunwin, 1,251, 11.3%, Dongfeng Yangtse, 1,080, 9.8%; market concentration of the first three manufacturers are 34.9%, which is over one third of market share, so we can see that degree of monopoly of ten-eleven-meter buses is comparatively high.
b. Market concentration of the first ten manufacturers is 34.9%, so other bus builders only have 27% chances to enter the market.
