Summarize:3. Analysis of Coach and Inner City Bus for Length
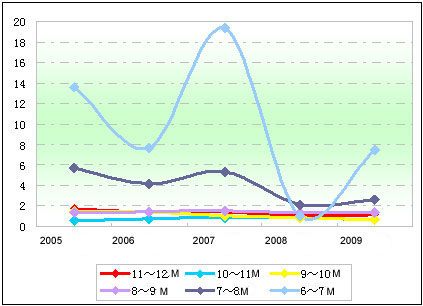
A. The Ratio of Sales Volume between Them
| |
11~12M
|
10~11M
|
9~10M
|
|
2005
|
1.73
|
0.58
|
1.43
|
|
2006
|
1.47
|
0.75
|
1.45
|
|
2007
|
1.49
|
0.87
|
1.03
|
|
2008
|
1.09
|
0.84
|
0.87
|
|
2009
|
1.20
|
0.64
|
0.68
|
|
|
8~9M
|
7~8M
|
6~7M
|
|
2005
|
1.39
|
5.69
|
13.56
|
|
2006
|
1.42
|
4.15
|
7.68
|
|
2007
|
1.59
|
5.34
|
19.32
|
|
2008
|
1.40
|
2.17
|
1.06
|
|
2009
|
1.35
|
2.59
|
7.48
|

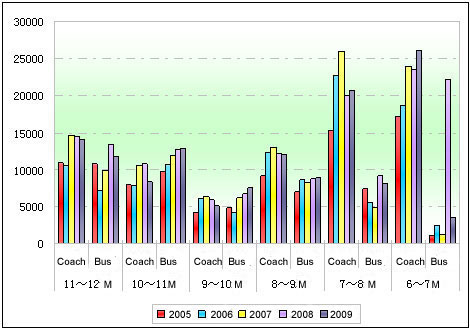
B. Sales Volume Statistics
| |
11~12M
|
10~11M
|
9~10M
|
|
|
Coach
|
Inner City Bus
|
Coach
|
Inner City Bus
|
Coach
|
Inner City Bus
|
|
2005
|
10864
|
10734
|
7873
|
9741
|
4123
|
4896
|
|
2006
|
10523
|
7151
|
7851
|
10647
|
6084
|
4208
|
|
2007
|
14651
|
9804
|
10427
|
11925
|
6365
|
6172
|
|
2008
|
14591
|
13445
|
10719
|
12730
|
5889
|
6777
|
|
2009
|
14190
|
11789
|
8322
|
12959
|
5163
|
7566
|
| |
8~9M
|
7~8M
|
6~7M
|
|
|
Coach
|
Inner City Bus
|
Coach
|
Inner City Bus
|
Coach
|
Inner City Bus
|
|
2005
|
9150
|
6993
|
15326
|
7453
|
17246
|
1025
|
|
2006
|
12313
|
8645
|
22679
|
5470
|
18734
|
2393
|
|
2007
|
13061
|
8190
|
25908
|
4854
|
23927
|
1238
|
|
2008
|
12211
|
8711
|
19987
|
9201
|
23482
|
22200
|
|
2009
|
12041
|
8924
|
20780
|
8027
|
26160
|
3495
|

Remark: Regarding the 11-12m vehicle, coach and inner city bus have great increase in 2008. Both of them have very good market performance. 7-8m vehicle becomes the spotlight because the huge Chinese rural market propels this sector. The same case occurs in 6-7m vehicle. Currently, Chinese big cities and rural towns have very close relationship and more and more people commute between the downtown and the suburb. Besides, China's rural auto stimulus policy pushes the related sale. Short-distance coach is very popular.
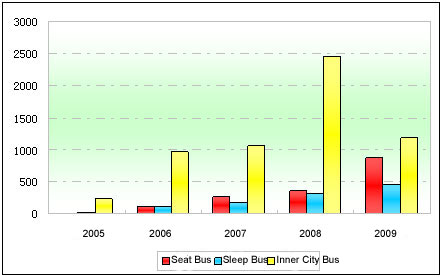
4. Sales Analysis of Large-sized Bus
Currently, the sale of large-sized bus has great increase, especially for the BRT bus sector. In the year of 2009, the situation is totally different and the sale is down. Whatever happens, large-sized bus sector can not occupy the main market share.
Sales Volume
|
Year
|
Seating Bus
|
Sleeper Coach
|
Inner City Bus
|
Total
|
|
2005
|
1
|
11
|
236
|
248
|
|
2006
|
110
|
109
|
968
|
1187
|
|
2007
|
268
|
176
|
1064
|
1530
|
|
2008
|
352
|
304
|
2451
|
3327
|
|
2009
|
873
|
451
|
1186
|
2510
|

Ratio between Them
|
Year
|
Seating Bus
|
Sleeper Coach
|
Inner City Bus
|
Remark
|
Ratio
|
|
2005
|
0.4
|
4.4
|
95.2
|
|
0.21
|
|
2006
|
9.3
|
9.2
|
81.5
|
|
0.85
|
|
2007
|
17.5
|
11.5
|
69.5
|
Not include others
|
0.91
|
|
2008
|
10.6
|
9.1
|
73.7
|
Not include others
|
2.04
|
|
2009
|
34.8
|
17.97
|
47.25
|
Not include others
|
1.53
|
Remark: The sale of large-sized buses reaches the peak. However, its total market share can not break through 2 percent. Hence, it can not become the mainstream. In the year of 2009, the sleeper coach sector also has great increase and the market performance is well. The life cycle of sleeper coach in China can be prolonged.
