Summarize:www.chinabuses.org: Part 1 Analysis of sales growth on bus industry in 2009 compared with the same period of 2008
a. Overall sales growth in all lengths
Table 1 Statistics of overall sales growth in all lengths in 2009
|
|
Total
|
12<L
|
11<L≤12
|
10<L≤11
|
9<L≤10
|
|
2009
|
163618
|
2511
|
28280
|
21419
|
12738
|
|
2008
|
162298
|
3327
|
31017
|
23468
|
12876
|
|
Growth year on year
|
0.81
|
-24.5
|
-8.8
|
-8.7
|
-1.07
|
|
|
8<L≤9
|
7<L≤8
|
6<L≤7
|
5<L≤6
|
3.5<L≤5
|
|
2009
|
20807
|
28531
|
29991
|
11226
|
8115
|
|
2008
|
20924
|
29261
|
23482
|
9625
|
8318
|
|
Growth year on year
|
-0.56
|
-2.5
|
27.7
|
16.6
|
-2.44
|

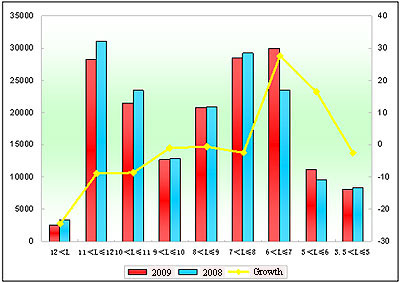
Figure 1 Statistics of overall sales growth in all lengths in 2009
It can be seen from above that:
Sales volumes increased 0.81% YoY this year, and sales volumes of two lengths increased and seven lengths decreased. It is the first growth since Jan -45.9%, Feb -41.5%, March -34.2%, April -32.7%, May -32.2%, June -33.65%, July -28.03%, Aug -21.3%, Sept. -13.54%, Oct. -10.66%, and Nov. -4.04%. It illustrates that financial crisis’influence to bus industry starts fading, and the recovery is already clear. Super large buses which are over 12-meter long saw the biggest decline -24.5%, then it comes 11~12-meter -8.8%, 10~11-meter 8.7%, 6~7-meter 27.7% (the biggest growth), 5~6-meter 16.6%, and 9~10-meter 1.07%.
b. Sales growth analysis of Xiamen King Long in all lengths
Table 2 Statistics of overall sales growth in all lengths of Xiamen King Long in 2009
|
|
Total
|
12<L
|
11<L≤12
|
10<L≤11
|
9<L≤10
|
|
2009
|
15344
|
164
|
4253
|
1710
|
635
|
|
2008
|
13209
|
0
|
5807
|
1153
|
741
|
|
Growth year on year
|
16.16
|
100
|
-26.76
|
48.31
|
-14.3
|
|
Growth in bus industry
|
0.81
|
-24.5
|
-8.8
|
-8.7
|
-1.07
|
|
|
8<L≤9
|
7<L≤8
|
5<L≤6
|
3.5<L≤5
|
|
|
2009
|
2111
|
1873
|
4598
|
0
|
|
|
2008
|
2404
|
1340
|
1514
|
250
|
|
|
Growth year on year
|
-12.19
|
39.8
|
203.6
|
-100
|
|
|
Growth in bus industry
|
-0.56
|
-2.5
|
16.6
|
-2.44
|
|

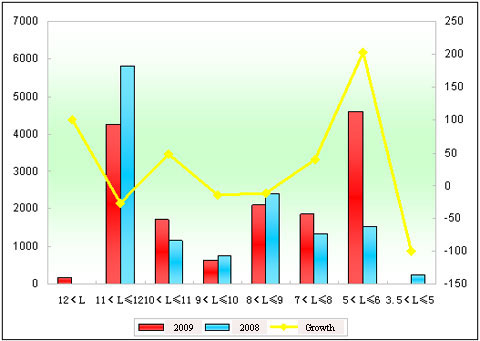
Figure 2 Statistics of overall sales growth in all lengths of Xiamen King Long in 2009
It can be seen from above that:
a. Sales volumes increased 2,135 units this year, up 16.16%, 15% more than the figure in the first eleven months, and 15.3% higher than the figure in bus industry, illustrating that increasing speed of King Long is speedy, and it is the only enterprises rising exceeding 15% among Kinglong, Higer, Golden Dragon and Yutong Bus.
b. Apart from 5-6-meter, 7-8-meter, 10-11-meter and super large bus, sales volumes of other lengths were decreasing, especially 3.5-5-meter, 11-12-meter, 9-10-meter, and 8-9-meter, down 100%, 26.76%, 14.3%, and 12.19%, lower than that of bus industry.
c. The increasing speed of Kinglong is ranking the first in bus industry, and sales volumes of 11-12-meter is still the second, only lower than Yutong Bus.
d. Sales volumes of Kinglong super large buses were 164 units, while there is no sales of such buses. And this played a vital role to improve profits and brands.
Part 2 Analysis of sales increase in all lengths in 2009 compared with that of 2008
a. Sales increase in all lengths in bus industry
Table 3 Statistics of sales increase in all lengths in 2009
|
|
Total
|
12<L
|
11<L≤12
|
10<L≤11
|
9<L≤10
|
|
2009
|
106275
|
873
|
14161
|
8425
|
5144
|
|
2008
|
103163
|
552
|
14591
|
10719
|
5889
|
|
Growth year on year
|
3.02
|
58.15
|
-2.9
|
-21.4
|
-12.65
|
|
|
8<L≤9
|
7<L≤8
|
6<L≤7
|
5<L≤6
|
3.5<L≤5
|
|
2009
|
11929
|
20566
|
26177
|
10885
|
8115
|
|
2008
|
12211
|
19987
|
22200
|
8696
|
8318
|
|
Growth year on year
|
-2.3
|
2.9
|
17.9
|
25.2
|
-2.44
|
It can be seen that:
Sales volumes of coaches increased 3.02% in 2009, higher than that of the overall bus markets. Super large buses, 5-6-meter, 6-7-meter and 7-8-meter were increasing, up 25.2%, 17.9% and 2.90%, and sales volumes of super large buses saw the biggest growth, but its radix is not big. And sales volumes of other lengths decreased, 10-11-meter, 9-10-meter and 11-120meter saw the biggest decreasing. It means that decreasing of coaches are the main factor in the overall markets in 2009, and the financial crisis had the least impact to coaches markets in 2009.
b. King Long coaches
Table 4 Statistics of sales increase in all lengths of Kinglong coaches in 2009
|
|
Total
|
12<L
|
11<L≤12
|
10<L≤11
|
9<L≤10
|
|
2009
|
12104
|
164
|
2182
|
1045
|
635
|
|
2008
|
9833
|
0
|
3314
|
636
|
741
|
|
Growth year on year
|
23.09
|
100
|
-34.16
|
64.3
|
-14.3
|
|
Increase in bus industry
|
3.02
|
58.15
|
-2.9
|
-21.4
|
-12.65
|
|
|
8<L≤9
|
7<L≤8
|
5<L≤6
|
3.5<L≤5
|
|
|
2009
|
1607
|
1873
|
4598
|
0
|
|
|
2008
|
2038
|
1340
|
1514
|
250
|
|
|
Growth year on year
|
-21.1
|
39.8
|
203.6
|
-100
|
|
|
Increase in bus industry
|
-2.3
|
2.9
|
25.2
|
-2.44
|
|

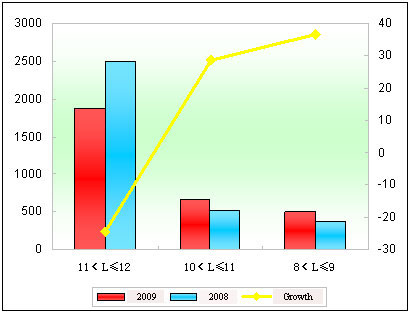
Figure 3 Statistics of sales increase in all lengths of Kinglong coaches in 2009
It can be seen from above that:
a. Sales volumes of Kinglong coaches rises 23.09%, nearly 18.4% higher than that of the first eleven months, and nearly 20% higher than that of the whole industry, illustrating that sales volumes of Kinglong coaches are increasing, and this is also the main factor in growth in sales volumes of Kinglong bus.
b. Sales volumes of 11-12-meter coaches decreased 34.16%, nearly 6% higher than the figure in the first eleven months, but 31.3% lower than that of bus industry. Sales volumes of 10-11-meter coaches increased 64.3%, nearly 85.7% higher than that of bus industry. Sales volumes of 8-9-meter coaches decreased 21.1%, 23% higher than that of bus industry; while 3,184 units were added in 5-6-meter coaches, showing that sales volumes of most lengths were lower than the first eleven months, and it was increasing overall for the great increase in 5-6-meter coaches.
In addition, five super large coaches were sold out in May, and 164 units were sold out in December, showing that sales of super large buses realized fleet sales.
