Summarize:www.chinabuses.org: Part 1 Statistical analysis of middle bus
1. Historical sales analysis of bus industry in China
Table 1 Sales statistics of bus from 2007-2009 Unit: vehicle
|
|
Jan.
|
Feb.
|
March
|
April
|
May
|
June
|
|
2007
|
13670
|
8808
|
10323
|
15028
|
12372
|
14498
|
|
2008
|
17124
|
6960
|
12374
|
15579
|
17003
|
23078
|
|
2009
|
9268
|
4961
|
9233
|
11840
|
11757
|
14474
|
|
|
July
|
August
|
Sept.
|
Oct.
|
Nov.
|
Dec.
|
|
2007
|
12768
|
14591
|
16698
|
12077
|
14995
|
21756
|
|
2008
|
10384
|
10732
|
12435
|
9439
|
10424
|
16062
|
|
2009
|
12632
|
15357
|
18801
|
12067
|
15224
|
23293
|

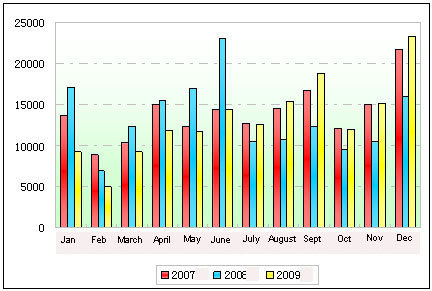
Figure 1 Sales statistics of bus from 2007-2009
It can be seen from above that:
1. There were two clear stages for China bus industry in the previous three years. The first stage was first half of 2007 till the same period in 2008. Chins bus builders were finishing upgrade of technology and craftsmanship and they started to explore overseas markets. And the second stage was from second half of 2008 to now, there were some record high sales volumes by the Olympic Games and in late 2009, china bus industry were severely influenced by global financial crisis, and currently it is under difficult structural adjustment periods.
2. Bus industry is influenced by seasons much.
3. Sales of domestic markets were clearly lower than the previous two years, especially February.
Part 2 Historical statistics of sales volumes of middle bus
Table 2 Sales statistics of middle bus from 2007-2009
Unit: vehicle
|
Year
|
Month
|
9<L≤10
|
8<L≤9
|
7<L≤8
|
Total
|
|
2008
|
Jan.
|
1103
|
2234
|
3380
|
6717
|
|
Feb.
|
477
|
814
|
1484
|
2775
|
|
March
|
1129
|
1463
|
2511
|
5103
|
|
April
|
1242
|
1789
|
3011
|
6042
|
|
May
|
1239
|
2408
|
3056
|
6703
|
|
June
|
1858
|
3049
|
4593
|
9500
|
|
July
|
711
|
1068
|
1415
|
3194
|
|
August
|
695
|
1549
|
1808
|
4052
|
|
Sept.
|
1069
|
1834
|
2129
|
5032
|
|
Oct.
|
981
|
1300
|
1261
|
3542
|
|
Nov.
|
798
|
1211
|
1831
|
3840
|
|
Dec.
|
1574
|
2205
|
2782
|
6561
|
|
2009
|
Jan.
|
837
|
1343
|
1641
|
3821
|
|
Feb.
|
253
|
544
|
647
|
1444
|
|
March
|
888
|
1236
|
1251
|
3375
|
|
April
|
906
|
1631
|
2002
|
4539
|
|
May
|
873
|
1489
|
2009
|
4371
|
|
June
|
878
|
2164
|
2870
|
5912
|
|
July
|
1023
|
1441
|
2377
|
4841
|
|
August
|
1157
|
1800
|
2449
|
5406
|
|
Sept.
|
1939
|
2531
|
3761
|
8231
|
|
Oct.
|
1255
|
1578
|
2065
|
4898
|
|
Nov.
|
1072
|
1973
|
3554
|
6599
|
|
Dec.
|
1657
|
3077
|
3905
|
8639
|
Figure2 Sales statistics of middle bus from 2007-2009
We can see that overall changes of middle buses are similar to that of bus industry. Sales volumes of medium buses in the later half year were clearly lower than that of first half year, especially 7-8m buses. and the overall sales of buses last fluctuated time by time. And the strong rebound in the fourth season laid a good foundation for 2010. We may say that comprehensive revive of bus and coach industry has started.
Part 3 Increment analysis of middle buses
Table 3 Sales increment analysis of middle buses in Dec. 2009 Unit: vehicle
|
|
Bus
|
Middle Bus
|
|
Dec. 2009
|
sales
|
Growth YoY
|
Growth MoM
|
sales
|
Growth YoY
|
Growth MoM
|
|
23293
|
53%
|
45%
|
8639
|
31%
|
32%
|
Figure 3 Sales increment analysis of middle buses in Dec. 2009
1. Sales volumes of buses in Dec. 2009 were 23,293 units, up 53% month on month and 45% year on year. The big surge of sales volumes this month shows that overall recovery of bus industry has started as financial crisis fades.
2. Sales of minibuses were 8,639 units in Dec. 2009, up 31% month on month and 32% year on year. Sales volumes of medium buses are still increasing compared with last month and last year. And this is due to increasing needs from overseas markets, promoting of seasonal needs in fall and fading financial crisis.
Part 4 Sales analysis of all lengths of middle buses
Table 4 Sales statistics of all lengths middle buses in Dec. 2009 Unit: vehicle
|
|
9<L≤10
|
8<L≤9
|
7<L≤8
|
|
2009.12
|
sales
|
Growth YoY
|
Growth MoM
|
sales
|
Growth YoY
|
Growth MoM
|
sales
|
Growth YoY
|
Growth MoM
|
|
1657
|
55%
|
5%
|
3077
|
56%
|
40%
|
3905
|
20%
|
40%
|

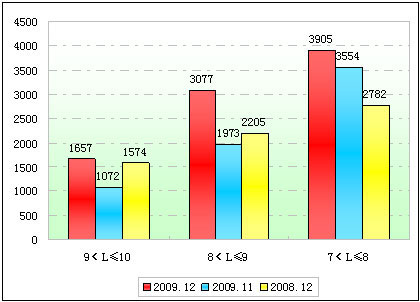
Figure 4 Sales statistics of all lengths middle buses in Dec. 2009
It can be seen from above that:
1. Sales volumes of middle buses between 7~8m were 3,905 units in December last year, up 20% month on month and 40% year on year. And this is the strongest power to drive sales increasing of middle buses even the whole bus industry.
2. Sales volumes of middle buses between 8~9m were 3,077 units in December last year, up 56% month on month and 56% year on year. Market needs for the length were low in the past two years, but this year the markets are surging.
3. Sales volumes of middle buses between 9~10m were 1,657 units in December last year, up 55% month on month and 5% year on year. Sales volumes of this length were the lowest, and they got the profound influence of large buses. However, we predict that markets need for this length are getting better.
Part 5 Market share analysis of middle bus
Table 5 Market shares of middle buses in Dec. 2009
Unit: vehicle
|
|
Total
|
Middle Buses
|
9<L≤10
|
8<L≤9
|
7<L≤8
|
|
Sales Volumes
|
23293
|
8639
|
1657
|
3077
|
3905
|
|
Percentage of all buses
|
—
|
37.09%
|
7.11%
|
13.21%
|
16.76%
|
|
Percentage of minibuses
|
—
|
—
|
19.18%
|
35.62%
|
45.20%
|

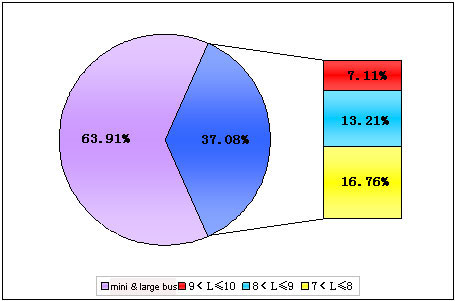
Figure 5 Market shares of middle buses in Dec. 2009
We can see from the pie chart that sales volumes of middle buses take 37.08% of overall bus sales, similar to that of last month. Among middle buses, sales volumes of 7~8m take 16.76% of overall buses and 45.20% of middle buses, the biggest share; sales volumes of 8~9m take 13.21% of overall buses and 35.62% of middle buses; then it comes 9~10m, sales volumes take 7.11% of overall buses and 19.18% of middle buses.
