Summarize:www.chinabuses.org:
General Description:
According to the driving standard, large bus means the passenger vehicle carrying more than 20 people; according to the industrial research standard, it means the bus with the length of over 10 meters.
In the face of the general development trend of bus industry, large bus market is currently regards as the bright potential market and the main sales market for many bus manufacturers with comparatively much profit. Large bus remained steady growth in the background of the shrinking market demand of bus industry in last June. More obvious of the trend of upsizing and high-grade of buses, better development of the large buses. We confront both the shrinking market demand due to the financial crisis and hope and opportunity because of the large-scale economic revival plan of some countries. However, based on the high requirements of producing technology, complex workmanship and high cost, the market is occupied by only a few builders such as Kinglong, Yutong, Zhongtong, and Huanghai for a long time. Driven by the high added-value of large buses, many bus builders changed the strategy and stepped into high-end large bus market such as Shaolin, Shanghai Sunlong, Beiqi Foton, Zhengjiang Youngman. It is predicted that the competition of large bus market will be fiercer and there comes into being of monopolistic competition market. Influenced by the new energy bus policies, new products as well as technology appear such as full loading of Ankai Bus, natural gas buses of Hengtong, Zhongtong BRT and Youngman low floor double-deck buses. New market demand and technology will roundly promote the further development of large bus industry.
In the first half of 2009, it sells 61591 buses in total, 33.65% down compared with last year (92822 units). The market demand withers obviously since the last half of 2008 and the sales still remains till the first half of 2009. On the one hand, there are the adverse factors of financial crisis, ambiguous oil price and tax policy and the comparative advantage of railway transport. On the other hand, the favorable factors show: the forthcoming of the boom season, the rebounding of the various economy indexes, segment market of new energy buses and mass buses updating. Basically, the current market is that minibuses: 18357 units, 29% down year-on-year; medium buses: 23462, 36% down year-on-year; large buses: 19772 units, 35% down year-on-year. In lengths, the smallest decline in sales show in 6<L≤7m (27% down) and 10<L≤11m (24% down), and then 10<L≤11m, 39% down; 7<L≤8m, 42% down. The launching of 897 buses with over 12-meter length in the first half of year displays that the major sales power comes from this length.
In the last half of 2009, the bus industry comes into the traditional boom season. Transportation: Kinglong won the bidding of Guangzhou BRT and got the order of 110 units; Shijiazhuan purchased 600 natural gas buses; the fuel consumption reduced 15% for Beijing hybrid power buses; the initial appearing of high-end buses showed in second and third line cities. Bus Builders: The Shenyang bus base of GAIG put into operation with annual production of 4000 units; Higer changed into waving "H" mark; Yutong served the national celebration; Yancheng Zonda Qingshan electric bus project possibly will produce in next year. Policy: Ankai Bus served Davos Forum; it is ambiguous for double-deck buses; electricity multiple unit came forth; Shangshai planed to increase new energy subsidy.
Data Analysis of Large Buses
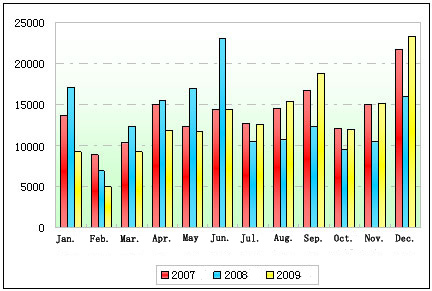
Table one: the statistic table of bus sales from 2007 to 2009
|
Jan.
|
Feb.
|
Mar.
|
Apr.
|
May
|
Jun.
|
|
2007
|
13670
|
8808
|
10323
|
15028
|
12372
|
14498
|
|
2008
|
17124
|
6960
|
12374
|
15579
|
17003
|
23078
|
|
2009
|
9268
|
4961
|
9233
|
11840
|
11757
|
14474
|
|
|
Jul.
|
Aug.
|
Sep.
|
Oct.
|
Nov.
|
Dec.
|
|
2007
|
12768
|
14591
|
16698
|
12077
|
14995
|
21756
|
|
2008
|
10384
|
10732
|
12435
|
9439
|
10424
|
16062
|
|
2009
|
12632
|
15357
|
18801
|
12067
|
15224
|
23293
|
The chart for vivid description
Shown above:
1. There are two stages for the overall development of China bus industry: Jan.-June 2007(limited by table, actually dating back to the first half of 2005) and from July 2008 till now. The sales growth and general development of bus industry was generated by domestic factors (the broad application of new technology, models and the obvious demand of market updating), high demand of the overseas market and policy support (public transport first, urban and rural infrastructure construction and Olympic economy) in the first stage. Affected by the emission policy and Olympic economy, there were a great number of buses launching ahead of time to make the sales record of China bus history for single month, and then followed the shrinking sales, financial crisis, even the traditional boom season was not effective, which promoted the current hardship for structural adjustment in the second stage.
2. Bus industry is typically impacted by seasons. Generally speaking, low volume in the first quarter, especially in February; pick-up in the second quarter, in particular in June; peak in the third quarter; higher launching volume of buses in the forth quarter. And then next year comes.
3. The sales level of buses in this first quarter is lower than those of previous two years, in particular in February with lowest level in the history of single month. It obviously grows up in March and April; staged call-back in May, basically same level as April; increases in June; declines with a small margin in July; distinctly renounces in August and September with the sales record of single month in this year, recovery of bus industry clearly showing; a little downturn in October; high sales volume in November and December with the single month's record of 23293 units in December.
Table Two: the sales statistic of large buses from 2008 and 2009
|
Year
|
Month
|
12<L
|
11<L≤12
|
10<L≤11
|
合计
|
|
2008
|
Jan.
|
433
|
3710
|
1817
|
5960
|
|
Feb.
|
212
|
1252
|
825
|
2289
|
|
Mar.
|
397
|
2086
|
1515
|
3998
|
|
Apr.
|
328
|
2959
|
1724
|
5011
|
|
May
|
375
|
2798
|
2040
|
5213
|
|
Jun.
|
488
|
3832
|
3435
|
7755
|
|
Jul.
|
316
|
2309
|
2634
|
5259
|
|
Aug.
|
89
|
2588
|
1683
|
4360
|
|
Sep.
|
166
|
2408
|
2283
|
4857
|
|
Oct.
|
103
|
1892
|
1394
|
3389
|
|
Nov.
|
127
|
1937
|
1926
|
3990
|
|
Dec.
|
293
|
3246
|
2192
|
5731
|
|
2009
|
Jan.
|
167
|
1529
|
1182
|
2878
|
|
Feb.
|
73
|
771
|
1006
|
1850
|
|
Mar.
|
186
|
1447
|
1157
|
2790
|
|
Apr.
|
95
|
2106
|
1538
|
3739
|
|
May
|
243
|
2081
|
1498
|
3822
|
|
Jun.
|
133
|
2292
|
2268
|
4693
|
|
Jul.
|
63
|
2079
|
1799
|
3941
|
|
Aug.
|
180
|
2814
|
1953
|
4947
|
|
Sep.
|
526
|
3362
|
2456
|
6344
|
|
Oct.
|
197
|
2346
|
1430
|
3973
|
|
Nov.
|
222
|
2938
|
1962
|
5122
|
|
Dec.
|
426
|
4515
|
3170
|
8111
|
Chart Two: the sales chart of large buses from 2008 and 2009
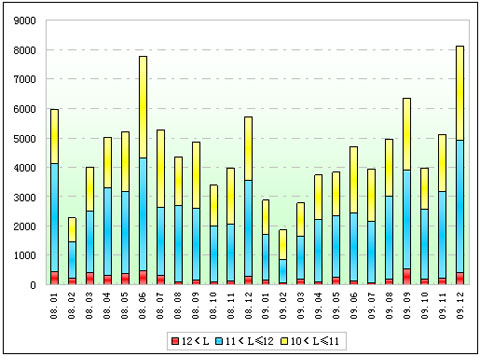
Shown above, the general change trend and the seasonal fluctuating trend of large buses quite close to that of the whole bus industry: obviously low sales volume in Feb. and high level in June and Dec. The sales level in the first half is better than that in the last half of 2009. The negative growth of link relative belongs to the normal seasonal performance. The sales quickly pick up in August and September and come to the peak in Dec. We are positive of the short and long term prospect for large buses due to the factors of buses updating, forthcoming of new energy bus era, unchangeable trend of upsizing.
Table Tree: the sales growth rate of buses (large buses included) Dec. (Unit: Vehicle)
|
|
Bus
|
Large Bus
|
|
Dec.,2009
|
sales
|
year-on-year growth
|
link relative growth
|
sales
|
year-on-year growth
|
link relative growth
|
|
23293
|
53%
|
45%
|
8111
|
58%
|
42%
|
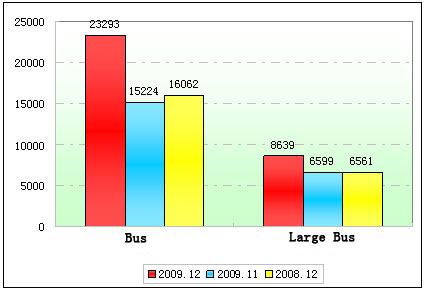
Chart Tree: the sales growth rate of buses (large buses included) Dec.
Shown above:
1. It sells 23293 buses in Dec.2009, link relative 53% up, year-on-year 45% up: callback in May; a little blowout in August; positive trend in Oct. and Dec. The big link relative growth indicates the clue of full recovery of bus industry.
2. It sells 8111 large buses, link relative 58% up, year-on-year 42% up. The gradual return of large buses in the second quarter aligns with the trend of the general industry. In our opinion, the increasing of the market demand of large buses will be tender in the short term compared with the medium and minibuses and we are still confident of the development of large buses in the long term.
Table Four: the sales table of large buses in various length (Unit: Vehicle)
|
|
12<L
|
11<L≤12
|
10<L≤11
|
|
|
sales
|
year-on-year
growth
|
link relative
growth
|
sales
|
year-on-year
growth
|
link relative
growth
|
sales
|
year-on-year
growth
|
link relative
growth
|
|
426
|
92%
|
45%
|
4515
|
54%
|
39%
|
3170
|
62%
|
44%
|
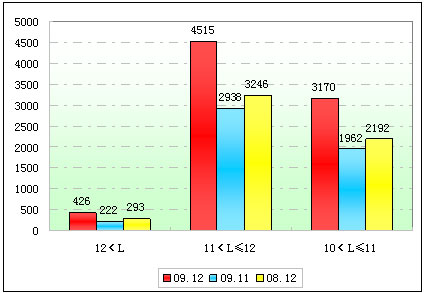
Chart Four: the sales chart of large buses in various length Unit: Vehicle
Shown above:
1. It sells 3170 units in 10<L≤11m, link relative 62% up, year-on-year 44% up in Dec., 2009. The market demand of this length is not clear and takes on weak regularity.
2. It sells 4515 units in 11<L≤12m, link relative 54% up, year-on-year 39% up in Dec.,2009. This length represents the producing level, technology capability, profit level of large buses. The market demand is strong in the past two years but just so so in the first half and return speeds up in the last half of 2009.
3. It sells 426 units in 12m<L, link relative 92% up, year-on-year 45% up. Influenced by bus priority, Olympic economy and new measures of energy-saving, it realized rapid growth and in particular obviously fast in this month.
The Analysis of Market Shares of Large Buses
Table Five: the table of market share of large buses in Dec.,2009 (Unit: %)
|
|
Buses
|
Large Buses
|
12<L
|
11<L≤12
|
10<L≤11
|
|
Sales
|
23293
|
8111
|
426
|
4515
|
3170
|
|
Proportion of total buses
|
—
|
34.82%
|
1.83%
|
19.38%
|
13.61%
|
|
Proportion of large buses
|
—
|
—
|
5.25%
|
55.67%
|
39.08%
|
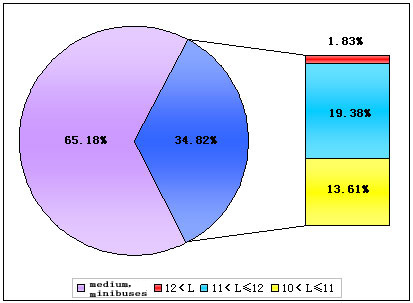
Chart Five: the chart of market share of large buses in Dec.,2009
Shown in the pie chart, the sales volume of large buses account for 34.82% of total buses, basically the same level of the previous month. 10<L≤11m: 13.61% of the total buses, 39.08% of large buses, it grows comparatively slowly;11<L≤12m: 19.38% of the total buses, 55.67% of large buses, a little more than last month; 12m<L: 1.83% of the total buses and 5.25% of large buses.
 editor@chinabuses.org
 86-10-84933192;


