Summarize:www.chinabuses.org: According to the statistics from Industry Development Center of Chinabuses.com, it pervasively turns on fast growing condition in the first quarter in 2010, compared with that in 2009. Major features are as followed:
The Biggest Jumps of Bus Sales in recent 5 years
The sales volume of buses is 21,000; 26,400; 31,600; 36,900; 24,300; 39,800 in the first quarter from 2005 to 2010 respectively.
|
Year
|
2005
|
2006
|
2007
|
2008
|
2009
|
2010
|
|
Sales Volume
|
21000
|
26400
|
31600
|
36900
|
24300
|
39800
|
|
Growth Rate
|
|
25.7
|
19.7
|
16.8
|
-34.1
|
63.8
|
Table 1: sales comparison of buses in the first quarter in the recent 5 years (Unit: Vehicle)
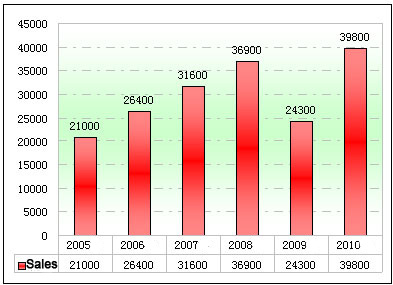
Chart 1: sales comparison of buses in the first quarter in the recent 5 years
Shown above, two outstanding points:
1. It grows strongly in single month in the first quarter.
Based on the year-on-year growth in a single month, it increases 90.75% in Jan., 70.75% in Feb., 31.18% in March 2010; 62.34% in June 2008 (affected by the transformation from Euro Ⅱ to Euro Ⅲ).
The accumulated sales of buses has year-on-year growth of 63.8% in the first quarter in 2010, a new record for sales in single quarter growth. It follows 37.01% in the second quarter in 2008 and 25.24% in the second quarter in 2006 (affected by public transport priority policy and export encouragement). The year-on-year growth no doubt refers to the gloomy market in the first quarter in 2009, however, the sales of 39,800 units has made new record, which marks a recovery of bus market.
2. Unbalanced growth
Among 23 sections in bus sales, there are 6 going down, in particular, almost 3 series of extra large-sized buses with negative growth. Three reasons for that:
a. The subway construction on is paid attention and no great passion in BRT in most cities.
b It requires comprehensive support equipments and more road resources for BRT.
c. The price and return are in direct proportion.
15 of 50 bus builders refer to extra large-sized buses, 7 companies grow and 8 companies fall. Details in table:
|
No.
|
Company
|
the first quarter, 2010
|
the first quarter,2009
|
Growth Rate
|
Growth
|
|
1
|
Yutong
|
55
|
105
|
-50
|
-47.62
|
|
2
|
Hengtong
|
34
|
3
|
31
|
1033.33
|
|
3
|
Young Man
|
29
|
107
|
-78
|
-72.9
|
|
4
|
Ankai
|
28
|
12
|
16
|
133.33
|
|
5
|
Nushen
|
22
|
8
|
14
|
175
|
|
6
|
Higer
|
14
|
30
|
-16
|
-53.33
|
|
7
|
Huanghai
|
11
|
37
|
-26
|
-70.27
|
|
8
|
Golden Dragon
|
11
|
0
|
11
|
-
|
|
9
|
North Neoplan
|
3
|
8
|
-5
|
-62.5
|
|
10
|
Kinglong
|
3
|
0
|
3
|
-
|
|
11
|
Zhongtong
|
1
|
6
|
-5
|
-83.33
|
|
12
|
Yaxing
|
1
|
0
|
1
|
-
|
|
13
|
Changlong
|
1
|
0
|
1
|
-
|
|
14
|
Zhongwei
|
0
|
2
|
-2
|
-100
|
|
15
|
Youyi
|
0
|
1
|
-1
|
-100
|
|
|
Total
|
213
|
319
|
-106
|
-33.23
|
Table 2: Analysis of market concentration of extra large-sized buses in the first quarter (Unit: Vehicle)
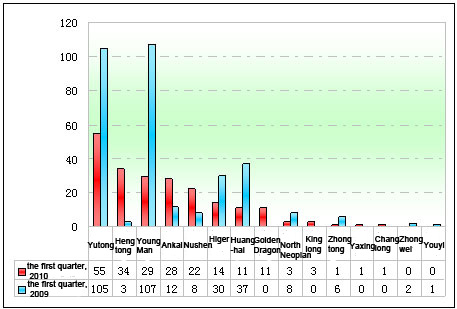
Chart 2: Analysis of market concentration of extra large-sized buses in the first quarter
Mainstream Bus Builders Grow Fast and Promotes the Whole Bus Industry
In the first quarter, 39 companies own the accumulated positive sales growth, particularly, 10 with growing rate over 100%, 23 with over 60% in total 50 bus builders. Top 15 companies show as followed in sales:
|
No.
|
Company
|
the first quarter,2010
|
the first quarter,2009
|
Growth Volume
|
Growth
|
|
1
|
Yutong
|
7014
|
3796
|
3218
|
84.77
|
|
2
|
Kinglong
|
4386
|
1956
|
2430
|
124.23
|
|
3
|
Higer
|
4185
|
2431
|
1754
|
72.15
|
|
4
|
Golden Dragon
|
4246
|
2611
|
1635
|
62.62
|
|
5
|
JAC
|
1220
|
428
|
792
|
185.05
|
|
6
|
Sunwin
|
1044
|
329
|
715
|
217.33
|
|
7
|
Zhongtong
|
1686
|
1037
|
649
|
62.58
|
|
8
|
Ankai
|
916
|
281
|
635
|
225.98
|
|
9
|
Young Man
|
917
|
465
|
452
|
97.2
|
|
10
|
Youyi
|
739
|
300
|
439
|
146.33
|
|
11
|
Dongte
|
1190
|
756
|
434
|
57.41
|
|
12
|
Foton
|
678
|
301
|
377
|
125.25
|
|
13
|
Quick
|
771
|
400
|
371
|
92.75
|
|
14
|
Sunlong
|
676
|
365
|
311
|
85.21
|
|
15
|
Shaolin
|
1510
|
1221
|
289
|
23.67
|
Table 3: analysis of market concentration of domestic bus companies in the first quarter (Unit: Vehicle)
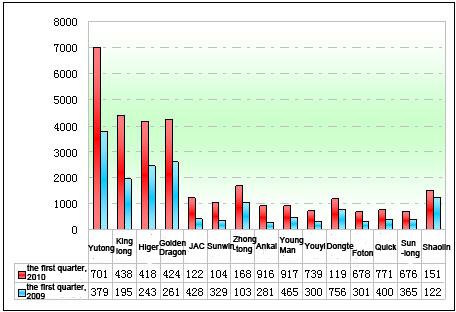
Chart 3: analysis of market concentration of domestic bus companies in the first quarter
The sales growth volume of Yutong, Kinglong, Higer and Golden Dragon exceed 1,500 units, and the related growth range of 37.25 percentage contributes a lot to the total growth rate of 64.17% in the whole industry. Therefore, it is an important characteristic that mainstream bus builders show crucial role for the industry in the first quarter. Two obvious points for that:
1. Balanced development
The development of bus market is usually unbalanced but the prosperity of mainstream bus builders affect the industry. In recent two years, the bus sales lack of big leap, which directly influenced by the different performance of mainstream bus builders. However, the average growth range of these four companies comes to 83.72%, far higher than the industry level.
2. Double Growth for large-sized buses
Based on the year-on-year growth, the large-sized buses own the biggest increasing range. Shown in Table 4, the average growth rate reaches 116.73%, more 33.43percentage than industry level for these 4 companies. Particularly, Higer grows 293.41%, 3.5 times more than industrial average range. It indicated the structure change of market demand is still to be expected due to such big increasing.
|
Company
|
Sales Volume
|
Large
|
Medium
|
Light
|
|
Yutong
|
7014
|
3092
|
3367
|
555
|
|
Kinglong
|
4386
|
1214
|
1268
|
1904
|
|
Golden Dragon
|
4246
|
797
|
660
|
2789
|
|
Higer
|
4185
|
1672
|
2049
|
464
|
|
Total
|
19831
|
6775
|
7344
|
5712
|
|
Industry
|
39828
|
13271
|
14663
|
11894
|
|
Company
|
Sales Volume
|
Large
|
Medium
|
Light
|
|
Yutong
|
3218
|
1578
|
1591
|
49
|
|
Kinglong
|
2430
|
347
|
512
|
1571
|
|
Golden Dragon
|
1635
|
477
|
268
|
890
|
|
Higer
|
1754
|
1247
|
476
|
31
|
|
Total
|
9037
|
3649
|
2847
|
2541
|
|
Industry
|
15568
|
6031
|
5613
|
3924
|
|
Company
|
Sales Volume
|
Large
|
Medium
|
Light
|
|
Yutong
|
84.77
|
104.23
|
89.58
|
9.68
|
|
Kinglong
|
124.23
|
40.02
|
67.72
|
471.77
|
|
Golden Dragon
|
62.62
|
149.06
|
68.37
|
46.87
|
|
Higer
|
72.15
|
293.41
|
30.26
|
7.16
|
|
Total
|
83.72
|
116.73
|
63.31
|
80.13
|
|
Industry
|
64.17
|
83.3
|
62.02
|
49.23
|
Table 4: the market concentration analysis of Yutong, Kinglong, Higer and Golden Dragon in the first quarter (Unit: Vehicle)
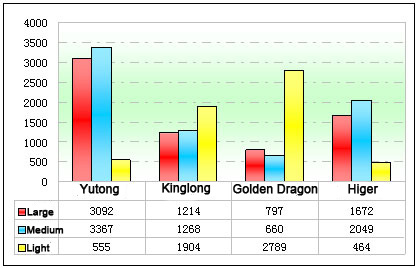
Chart 4: the market concentration analysis of Yutong, Kinglong, Higer and Golden Dragon in the first quarter
 editor@chinabuses.org
 86-10-84933192;


