Summarize:www.chinabuses.org:
Analysis of Sales Growth in Bus Industry from Jan. to Mar. in 2010 and in 2009
1. Sales Growth in Various Lengths for Buses
Table 1: Sales growth statistics table at various lengths in Jan.-Mar., 2010
|
|
Total
|
12<L
|
11<L≤12
|
10<L≤11
|
9<L≤10
|
|
Jan.-Mar.,2010
|
39828
|
213
|
8787
|
4271
|
2021
|
|
Jan.-Mar.,2009
|
23495
|
426
|
3747
|
3345
|
1978
|
|
year-on-year growth
|
69.5
|
-50
|
134.5
|
27.7
|
21.7
|
| |
8<L≤9
|
7<L≤8
|
6<L≤7
|
5<L≤6
|
3.5<L≤5
|
|
Jan.-Mar.,2010
|
6017
|
6625
|
5040
|
4425
|
2429
|
|
Jan.-Mar.,2009
|
3123
|
3539
|
4022
|
1746
|
1569
|
|
|
92.7
|
87.2
|
25.3
|
153.4
|
54.8
|

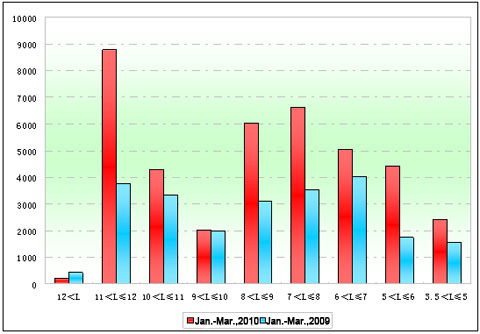
Chart 1: Sales growth statistics chart at various lengths in Jan.-Mar., 2010
Shown above:
In Jan.-Feb.2010, the sales has increases 90.94% compared with that over the same period in 2009. In lengths, sales grows up in seven lengths of buses (11-12meters, 5-6meters and 8-9meters) and falls in two (extra large buses and 9-10 meters).
2. Analysis of Sales Growth of Higer in Various Lengths of Buses.
Table 2: Sales growth statistics table of Higer Bus at various lengths in Jan.-Mar., 2010
| |
Total
|
12<L
|
11<L≤12
|
10<L≤11
|
|
Jan.-Mar.,2010
|
4185
|
14
|
963
|
695
|
|
Jan.-Mar.,2009
|
2431
|
30
|
323
|
72
|
|
|
72.15
|
-53.3
|
198
|
865
|
|
industry growth
|
69.5
|
-50
|
134.5
|
27.7
|
| |
9<L≤10
|
8<L≤9
|
7<L≤8
|
6<L≤7
|
|
Jan.-Mar.,2010
|
110
|
976
|
963
|
76
|
|
Jan.-Mar.,2009
|
601
|
422
|
550
|
433
|
|
|
-81.7
|
131.3
|
75.1
|
-82.4
|
|
industry growth
|
21.7
|
92.7
|
87.2
|
25.3
|

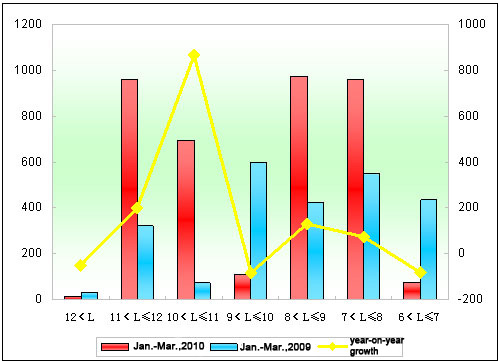
Chart 2: Sales growth statistics chart of Higer Bus at various lengths in Jan.-Mar., 2010
Shown above:
a. The sales range of Higer Bus is 72.15%, more almost 3 percentage in the first quarter 2010, in particular, 198% growth in 11-12meters bus, more almost 63.5 percentage than the industrial growth (134.5% growth). In the meanwhile, the sharpest decline for Higer Bus is 9-10 meters bus, and the biggest growth show at 10-11 meter bus ( 865%up ), which is far more than the industry growth.
b. No sales for extra large bus in January, but 14 units have been sold in the first quarter.
Sales Growth Analysis of Seat Buses at various lengths from Jan. to Mar. in 2010 and in 2009
1. Sales Growth of Seat Buses in Bus Industry at Various Lengths
Table 3: the sales growth statistics table of seat buses in Jan.-Mar., 2010
|
|
Total
|
12<L
|
11<L≤12
|
10<L≤11
|
9<L≤10
|
|
Jan.-Mar.,2010
|
27150
|
92
|
4867
|
2329
|
795
|
|
Jan.-Mar.,2009
|
15394
|
130
|
2036
|
1336
|
1044
|
|
|
76.4
|
-41.3
|
139
|
74.3
|
-23.85
|
| |
8<L≤9
|
7<L≤8
|
6<L≤7
|
5<L≤6
|
3.5<L≤5
|
|
Jan.-Mar.,2010
|
3532
|
4924
|
4346
|
3974
|
2291
|
|
Jan.-Mar.,2009
|
1757
|
2493
|
3358
|
1671
|
1569
|
|
|
101
|
97.5
|
29.4
|
137.8
|
46.01
|

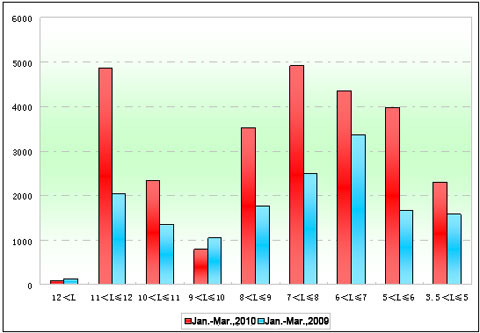
Chart 3: the sales growth statistics chart of seat buses in Jan.-Mar., 2010
Shown above:
The sales of seat buses goes up 76.4% in the first quarter, higher growth rate than that of general bus market. In lengths, apart from the decline in extra bus and 9-10 meters, it all increases in other lengths (biggest growth in 11-12 meters, then 5-6 meter, and 8-9 meters).
2. Seat Buses of Higer Bus
Table 4: the sales growth statistics table of seat buses of Higer Bus in Jan.-Mar., 2010
|
|
Total
|
12<L
|
11<L≤12
|
10<L≤11
|
|
Jan.-Mar.,2010
|
2981
|
7
|
659
|
359
|
|
Jan.-Mar.,2009
|
1901
|
30
|
273
|
71
|
|
|
56.8
|
-76.7
|
141.4
|
405.6
|
|
industry growth
|
76.4
|
-41.3
|
139
|
74.3
|
| |
9<L≤10
|
8<L≤9
|
7<L≤8
|
6<L≤7
|
|
Jan.-Mar.,2010
|
41
|
655
|
796
|
76
|
|
Jan.-Mar.,2009
|
322
|
269
|
503
|
433
|
|
|
-87.3
|
143.5
|
58.25
|
-82.4
|
|
industry growth
|
-23.85
|
101
|
97.5
|
29.4
|

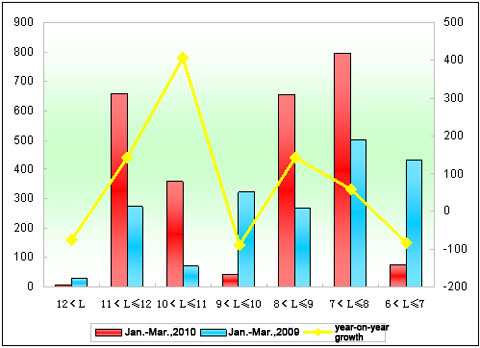
Chart 4: the sales growth statistics chart of seat buses of Higer Bus in Jan.-Mar., 2010
Shown above:
a. The sales of seat buses of Higer Bus increases 56.8% at various lengths while 76.4% up in the industry. It also indicated that there is no obvious effect of the growth of seat buses on the general increasing for Higer Bus.
b. The growth rate of Higer Bus comes to 129.8% in 11-12 meters buses, far less than the industry growth in the first quarter. It goes up 440% in 10-11 meters, more almost 300 percentage than industry growth; -87.1% in 9-10 meters (industry growth: -13.96%). It indicates that the traditionally powerful position in 9-10 meters buses is weakening.
