Summarize:www.chinabuses.org :
The Comparison Analysis of Sales Growth of Bus Industry in Jan.-Apr., 2010 and 2009
1. The sales growth at various lengths
Table 1: the statistics table of sales growth at various lengths in Jan.-Apr., 2010
|
|
Total
|
12<L
|
11<L≤12
|
10<L≤11
|
9<L≤10
|
|
Jan.-Apr.,2010
|
57597
|
447
|
12247
|
6467
|
3009
|
|
Jan.-Apr.,2009
|
35335
|
521
|
5853
|
4883
|
2884
|
|
year-on-year growth
|
63
|
-14.2
|
109.2
|
32.4
|
4.3
|
| |
8<L≤9
|
7<L≤8
|
6<L≤7
|
5<L≤6
|
3.5<L≤5
|
|
Jan.-Apr.,2010
|
8055
|
9590
|
7826
|
6555
|
3401
|
|
Jan.-Apr.,2009
|
4754
|
5541
|
6150
|
2515
|
2234
|
|
|
69.4
|
73.1
|
27.3
|
160.6
|
52.2
|

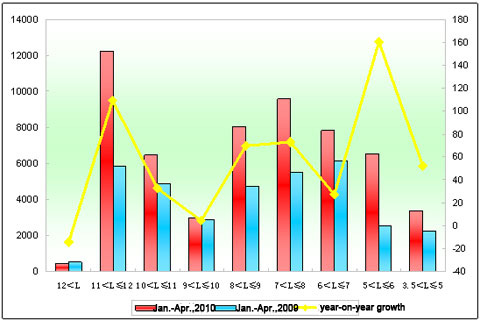
Chart 1:the statistics chart of sales growth at various lengths in Jan.-Apr., 2010
Shown above:
It goes up 63% in the first four months, 2010, compared with that over the period in 2009. In lengths, apart from the extra large bus, it increases in all other lengths with the biggest growth in 5-6 meter, and then 11-12 meter, 7-8 meter and the sharpest decline in 9-10 meter. It indicates the extra large bus market is still shrinking while other market segments are turning on the good development since 10 years ago.
2. Analysis of sales growth of Golden Dragon Bus in various lengths
Table 2: the statistics table of sales growth of Golden Dragon Bus at various lengths in Jan.-Apr., 2010
|
|
Total
|
12<L
|
11<L≤12
|
10<L≤11
|
9<L≤10
|
|
Jan.-Apr.,2010
|
6185
|
14
|
635
|
559
|
136
|
|
Jan.-Apr.,2009
|
3820
|
0
|
327
|
180
|
74
|
|
|
61.9
|
100
|
94.2
|
210.6
|
83.8
|
|
industry growth
|
63
|
-14.2
|
109.2
|
32.4
|
4.3
|
| |
8<L≤9
|
7<L≤8
|
6<L≤7
|
5<L≤6
|
3.5<L≤5
|
|
Jan.-Apr.,2010
|
665
|
162
|
664
|
315
|
3035
|
|
Jan.-Apr.,2009
|
393
|
132
|
447
|
160
|
2107
|
|
|
69.2
|
22.7
|
48.5
|
96.9
|
44.04
|
|
industry growth
|
69.4
|
73.1
|
27.3
|
160.6
|
52.2
|

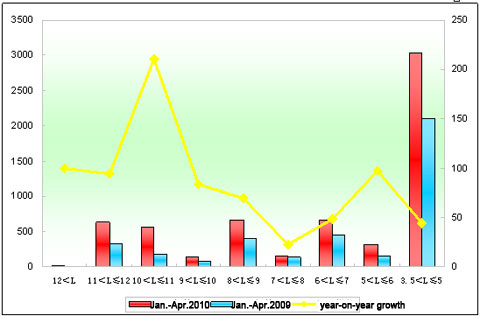
Chart 2:the statistics chart of sales growth of Golden Dragon Bus at various lengths in Jan.-Apr., 2010
Shown above:
a. Golden Dragon Bus increases 61.9% in the first months in 2010, compared with that over the same period in 2009, less 1.1 percentage than the industry level. It indicates that the sales growth of Golden Dragon Bus basically closed to that of industry and ranks the third in Yutong, Kinglong, Higer and Golden Dragon.
b. In lengths, the sales goes up in all lengths, in particular, 10-11 meter, 5-6 meter, and 11-12 meter. The sales volume of extra bus is 14 units while zero in the same period of 2009.
c. The product structure of Golden Dragon Bus is not so good (the sales of the buses with the length no longer than 8-meter account for 67%), which makes negative influence on profits.
The Comparison Analysis of Sales Growth of Seats Buses in Jan.-Apr., 2010 and 2009
1. The sales growth of seat buses at various lengths in bus industry
Table 3: the statistics table of seat buses at various lengths in Jan.-Apr., 2010
|
|
Total
|
12<L
|
11<L≤12
|
10<L≤11
|
9<L≤10
|
|
Jan.-Apr.,2010
|
39798
|
115
|
7343
|
3433
|
1147
|
|
Jan.-Apr.,2009
|
23171
|
168
|
3137
|
1959
|
1388
|
|
year-on-year growth
|
71.76
|
-31.5
|
134
|
75.2
|
-17.4
|
| |
8<L≤9
|
7<L≤8
|
6<L≤7
|
5<L≤6
|
3.5<L≤5
|
|
Jan.-Apr.,2010
|
4957
|
6855
|
6827
|
5964
|
3157
|
|
Jan.-Apr.,2009
|
2806
|
3845
|
5241
|
2393
|
2234
|
|
|
76.7
|
78.3
|
30.3
|
149.2
|
41.3
|

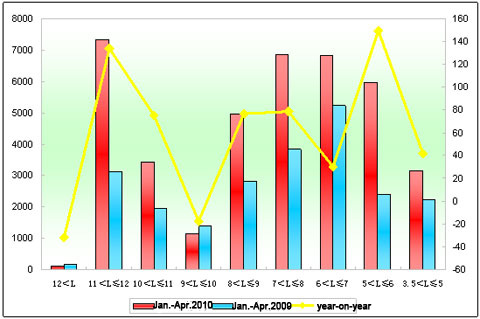
Chart 3:the statistics chart of seat buses at various lengths in Jan.-Apr., 2010
Shown above:
In the first four months, 2010, the sales of seat buses grows 71.76%. Apart from extra large bus and 9-10 meter bus, all other lengths go up, especially 5-6 meter. It indicates that the sales of extra large buses and 9-10 meter buses still fall. The development trend of rural passenger transport market is strong. The smallest growth shows in 6-7 meter, and then 7-8 meter, 11-12 meter. The general increasing of seats buses is the major force for the growing of buses in the first 4 month in 2010.
