Summarize:www.chinabuses.org:
2. Analysis of sales growth of Golden Dragon Seat Buses of Golden Dragon Bus
Table 4: the statistics table of sales growth of seats buses of Golden Dragon Bus at various lengths in Jan.-Apr., 2010
|
|
Total
|
12<L
|
11<L≤12
|
10<L≤11
|
9<L≤10
|
|
Jan.-Apr.,2010
|
5730
|
9
|
502
|
315
|
130
|
|
Jan.-Apr.,2009
|
3637
|
0
|
260
|
129
|
73
|
|
year-on-year growth
|
57.5
|
100
|
93.1
|
144.2
|
78.1
|
|
industry growth
|
71.76
|
-31.5
|
134
|
75.2
|
-17.4
|
| |
8<L≤9
|
7<L≤8
|
6<L≤7
|
5<L≤6
|
3.5<L≤5
|
|
Jan.-Apr.,2010
|
631
|
129
|
664
|
315
|
3035
|
|
Jan.-Apr.,2009
|
392
|
69
|
447
|
160
|
2107
|
|
|
60.97
|
86.96
|
48.5
|
96.9
|
44.04
|
|
industry growth
|
76.7
|
78.3
|
30.3
|
149.2
|
41.3
|
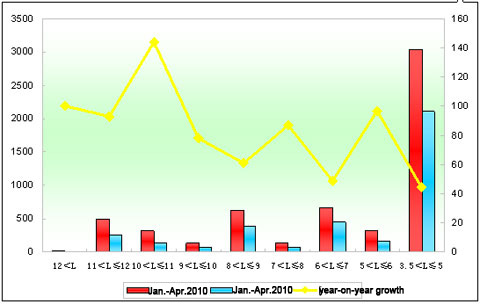
Chart 4:the statistics chart of sales growth of seats buses of Golden Dragon Bus at various lengths in Jan.-Apr., 2010
Shown above:
a. The sales of Golden Dragon Bus increase 57.5%, less 14 percentage than industry level in the first four months, 2010. It indicates that the growth sales range of Golden Dragon Bus is lower than both that of industry and of general market and possibly is affected by the sales of city buses.
b. The sales growth speed of the buses in the length of 10-11 meter, 9-10 meter, 7-8 meter, 6-7 meter and 3.5-5 meter is higher than that of industry and lower in other lengths.
Analysis of Sales Growth of Public Transport Buses in Jan.-Apr., 2010 and 2009
1. The sales growth of public transport buses at various lengths in bus industry
Table 5: the statistics table of public transport buses at various lengths in Jan.-Apr., 2010
|
|
Total
|
12<L
|
11<L≤12
|
10<L≤11
|
9<L≤10
|
|
Jan.-Apr.,2010
|
16381
|
264
|
3841
|
3025
|
1843
|
|
Jan.-Apr.,2009
|
11372
|
264
|
2088
|
2923
|
1494
|
|
year-on-year
|
44.5
|
0
|
66.7
|
34.9
|
23.4
|
| |
8<L≤9
|
7<L≤8
|
6<L≤7
|
5<L≤6
|
3.5<L≤5
|
|
Jan.-Apr.,2010
|
3013
|
2721
|
900
|
530
|
244
|
|
Jan.-Apr.,2009
|
1938
|
1696
|
847
|
122
|
0
|
|
year-on-year
|
55.5
|
60.4
|
6.3
|
334
|
100
|
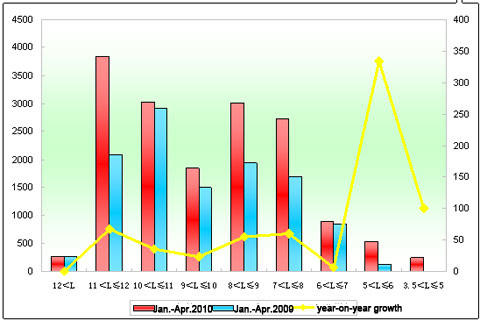
Chart 5:the statistics chart of public transport buses at various lengths in Jan.-Apr., 2010
The sales of public transport buses grows 44.5% in the first 4 months and it indicates that its market is fast recovering, but the growth rate is not as high as that of seat buses. In lengths, it all shows positive growth in all except zero growth over 12-meter, especially 5-6 meter (334% growth).
2. The sales growth of public transport buses of Golden Dragon Bus at various lengths
Table 6: the statistics table of public transport buses of Golden Dragon Bus at various lengths in Jan.-Apr., 2010
|
|
Total
|
11<L≤12
|
10<L≤11
|
|
Jan.-Apr.,2010
|
387
|
70
|
244
|
|
Jan.-Apr.,2009
|
168
|
52
|
51
|
|
year-on-year growth
|
130.6
|
34.6
|
378
|
|
industry growth
|
44.5
|
66.7
|
34.9
|
| |
9<L≤10
|
8<L≤9
|
7<L≤8
|
|
Jan.-Apr.,2010
|
6
|
34
|
33
|
|
Jan.-Apr.,2009
|
1
|
1
|
63
|
|
|
500
|
3300
|
-47.6
|
|
industry growth
|
23.4
|
55.5
|
60.4
|
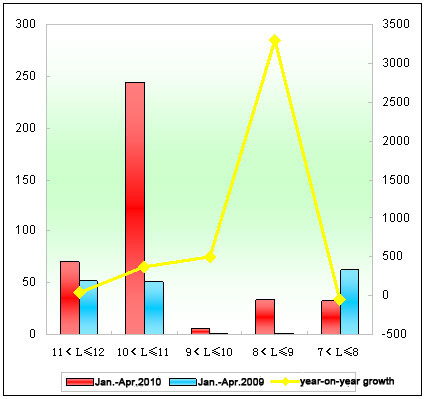
Chart 6:the statistics chart of public transport buses of Golden Dragon Bus at various lengths in Jan.-Apr., 2010
Shown above,
a. The sales of public transport buses of Golden Dragon Bus comes to 387 units, year-on-year growth of 168, 130.6%up, higher than industry level in Jan.-Apr., It indicated the growth trend of public transport buses is increasingly strong. On the other hand, the growth rate of Golden Dragon Bus is the highest among Yutong, Kinglong, Higer and Golden Dragon Bus, however, it can not affect the general growth of Golden Dragon Bus due to tiny base.
b. The growth mainly shows in 10-11 meter (378%growth; 193 units) and 8-9 meter (33 units). The growth number is small that is not able to spur growth of Golden Dragon Bus. It drops in 7-8 meter.
 editor@chinabuses.org
 86-10-84933192;


