Summarize:www.chinabuses.org: Part 1 Analysis of sales growth on bus industry in Jan. to April 2010 compared with the same period of 2009
a. Overall sales growth in all lengths
Table 1 Statistics of overall sales growth in all lengths
|
Total
|
12<L
|
11<L≤12
|
10<L≤11
|
9<L≤10
|
|
Jan. to April 2010
|
57597
|
447
|
12247
|
6467
|
3009
|
|
Jan. to April 2009
|
35335
|
521
|
5853
|
4883
|
2884
|
|
Growth
|
63
|
-14.2
|
109.2
|
32.4
|
4.3
|
| |
8<L≤9
|
7<L≤8
|
6<L≤7
|
5<L≤6
|
3.5<L≤5
|
|
Jan. to April 2010
|
8055
|
9590
|
7826
|
6555
|
3401
|
|
Jan. to April 2009
|
4754
|
5541
|
6150
|
2515
|
2234
|
|
Growth
|
69.4
|
73.1
|
27.3
|
160.6
|
52.2
|
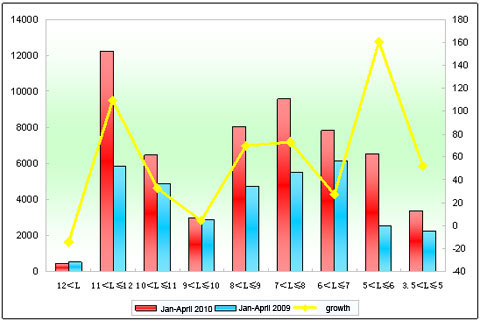
Figure 1 Statistics of overall sales growth in all lengths
It can be seen from above that:
Sales volumes increased 63% in the first four month over the same period in 2009, and sales volumes of all lengths except super large buses increased. It is the fourth growth since three consecutive months this year. Five-six meter buses saw the biggest decline, then it comes 11~12-meter, 7~8-meter and 9~10-meter. It can be seen that super large buses markets are continuing withering, and other segment markets are increasing, maintaining good development mode since this year.
b. Sales growth analysis of Xiamen King Long in all lengths
Table 2 Statistics of overall sales growth in all lengths of Xiamen King Long
|
Total
|
12<L
|
11<L≤12
|
10<L≤11
|
9<L≤10
|
|
Jan. to April 2010
|
6658
|
15
|
1375
|
717
|
162
|
|
Jan. to April 2009
|
3036
|
3
|
1008
|
360
|
228
|
|
Growth
|
119.3
|
400
|
36.4
|
99.17
|
28.9
|
|
Growth in bus industry
|
63
|
-14.2
|
109.2
|
32.4
|
4.3
|
| |
8<L≤9
|
7<L≤8
|
6<L≤7
|
5<L≤6
|
|
|
Jan. to April 2010
|
927
|
548
|
309
|
2605
|
|
|
Jan. to April 2010
|
674
|
250
|
0
|
513
|
|
|
Growth
|
37.5
|
119.2
|
100
|
407.8
|
|
|
Growth in bus industry
|
69.4
|
73.1
|
27.3
|
160.6
|
|
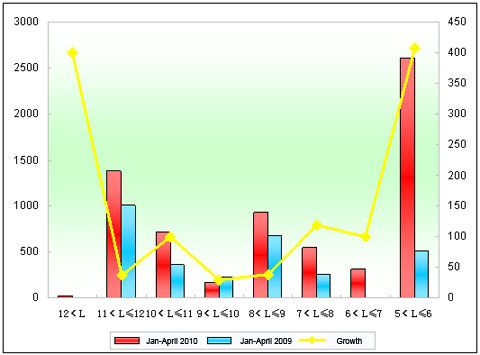
Figure 2 Statistics of overall sales growth in all lengths of Xiamen King Long
It can be seen from above that:
a. Sales volumes increased 3,622 units in the first foue months this year, up 119.3%, 56% more than the figure in China bus industry, illustrating that increasing speed of King Long is speedy, and it is also the biggest growth enterprise among Kinglong, Higer, Golden Dragon and Yutong Bus.
b. All length saw growth in this period, especially in 5-6-meter, super large buses and 7-8-meter length.
c. Although growth fastest in the first four months among Kinglong, Higer, Golden Dragon and Yutong Bus, its super large bus sales was listed the third in last November and December, less than Yutong and Higer, showing that King Long traditional advantages is fading.
Part 2 Analysis of sales increase of coaches in all lengths in the first four months in 2010 compared with that of 2009
a. Sales increase in all lengths in bus industry
Table 3 Statistics of sales increase in all lengths in the first four months in 2010
|
总计
|
12<L
|
11<L≤12
|
10<L≤11
|
9<L≤10
|
|
Jan. to April 2010
|
39798
|
115
|
7343
|
3433
|
1147
|
|
Jan. to April 2009
|
23171
|
168
|
3137
|
1959
|
1388
|
|
Growth
|
71.76
|
-31.5
|
134
|
75.2
|
-17.4
|
| |
8<L≤9
|
7<L≤8
|
6<L≤7
|
5<L≤6
|
3.5<L≤5
|
|
Jan. to April 2010
|
4957
|
6855
|
6827
|
5964
|
3157
|
|
Jan. to April 2009
|
2806
|
3845
|
5241
|
2393
|
2234
|
|
Growth
|
76.7
|
78.3
|
30.3
|
149.2
|
41.3
|
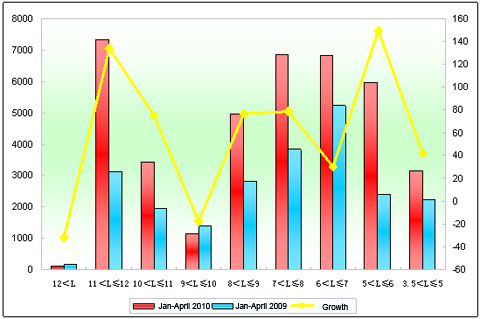
Figure 3 Statistics of sales growth of coaches in all lengths in the first four months 2010
It can be seen from above that:
Sales of coaches increased 71.76% in the first four months. Sales of all lengths were increasing except super large buses and 9-10-meter buses, showing that sales of super large buses are still decreasing, so are 9-10-meter buses. Five-six-meter saw the biggest growth, showing that needs from rural markets are powerful. And then it comes 11-12-meter bus, 7-8-meter buses and 6-7-meter buses. It shows that sales growth of coaches is the main factor to drive growth of complete vehicles in the first four months.
 editor@chinabuses.org
 86-10-84933192;


