Summarize:www.chinabuses.org: 2. Xiaman King Long coaches
Table 4 Statistics of sales increase in all lengths of King Long in the first four months in 2010
|
Total
|
12<L
|
11<L≤12
|
10<L≤11
|
9<L≤10
|
|
Jan. to April 2010
|
5648
|
0
|
1114
|
534
|
95
|
|
Jan. to April 2009
|
2207
|
3
|
550
|
163
|
228
|
|
Growth
|
155.9
|
-100
|
102.5
|
227.6
|
-58.3
|
|
Growth in bus industry
|
71.76
|
-31.5
|
134
|
75.2
|
-17.4
|
| |
8<L≤9
|
7<L≤8
|
6<L≤7
|
5<L≤6
|
|
|
Jan. to April 2010
|
612
|
379
|
309
|
2605
|
|
|
Jan. to April 2009
|
500
|
250
|
0
|
513
|
|
|
Growth
|
22.4
|
51.6
|
100
|
407.8
|
|
|
Growth in bus industry
|
76.7
|
78.3
|
30.3
|
149.2
|

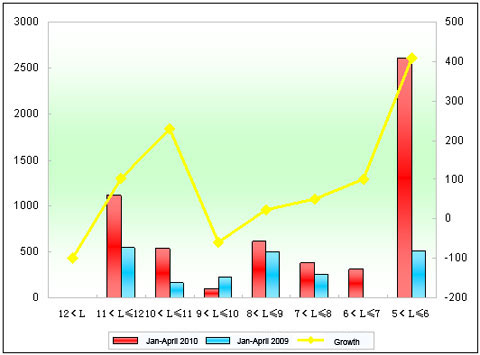
Figure 4 Statistics of sales increase in all lengths of King Long in the first four months in 2010
It can be seen from above that:
a.Sales of Xiamen King Long increased 155.9%, nearly 36% more than growth of King Long coaches in the first four months, showing that sales of coaches were growing fast in the first four months, and it also contributes the growth of King Long bus.
b. Sales growth of 11-12-meter was up to 102.5%, nearly 32% higher than average bus industry; Sales growth of 10-11-meter was up to 227.6%, the figure for 8-9-meter buses was 22.4%, 54% lower than the average China bus industry, showing that sales growth of all lengths of King Long Bus grew than the first tree months.
c. It is worth to mention that the powerful growth of 5-6-meter buses is the main power to drive growth of coaches. In addition, King Long didn’t sell any buses in the first four months this year, but three buses were sold in the same period last year.
Part 3 Analysis of sales increase of all lengths city buses in the first four months in 2010 compared that of 2009
1. Sales growth of city buses of all lengths
Table 5 Statistics of sales increase of all lengths city buses in the first four months in 2010
|
Total
|
12<L
|
11<L≤12
|
10<L≤11
|
9<L≤10
|
|
Jan. to April 2010
|
16381
|
264
|
3841
|
3025
|
1843
|
|
Jan. to April 2009
|
11372
|
264
|
2088
|
2923
|
1494
|
|
Growth
|
44.5
|
0
|
66.7
|
34.9
|
23.4
|
| |
8<L≤9
|
7<L≤8
|
6<L≤7
|
5<L≤6
|
3.5<L≤5
|
|
Jan. to April 2010
|
3013
|
2721
|
900
|
530
|
244
|
|
Jan. to April 2009
|
1938
|
1696
|
847
|
122
|
0
|
|
Growth
|
55.5
|
60.4
|
6.3
|
334
|
100
|

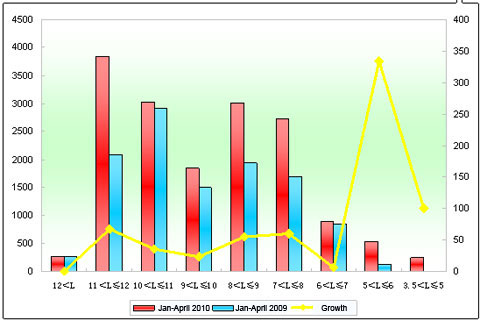
Figure 5 Statistics of sales increase of all lengths city buses in the first four months in 2010
Sales of city buses in the first four months grew 44.5%, and it is also the fourth consecutive month since last year, showing that city bus market is recovering, but not as big as coach markets. Sales of all lengths were increasing except 12-meter above, especially 5-6-meter long buses, up 334%, showing that sales for rural areas started to increase.
2. King Long city buses
Table 6 Statistics of sales increase of all lengths of King Long City Buses in the first four months in 2010
|
Total
|
12<L
|
11<L≤12
|
10<L≤11
|
|
Jan. to April 2010
|
901
|
13
|
227
|
183
|
|
Jan. to April 2009
|
826
|
0
|
455
|
197
|
|
Growth
|
9.09
|
100
|
-50.1
|
-7.1
|
|
Growth in bus industry
|
44.5
|
0
|
66.7
|
34.9
|
| |
9<L≤10
|
8<L≤9
|
7<L≤8
|
|
|
Jan. to April 2010
|
67
|
242
|
169
|
|
|
Jan. to April 2009
|
0
|
174
|
0
|
|
|
Growth
|
100
|
39.1
|
100
|
|
|
Growth in bus industry
|
23.4
|
55.5
|
60.4
|
|

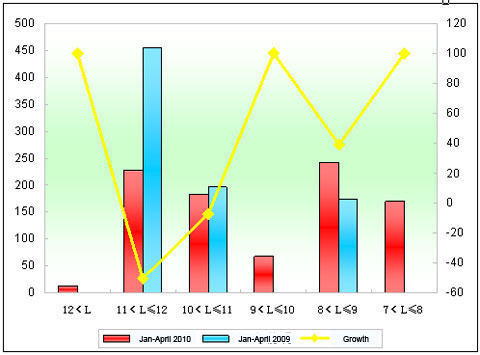
Figure 6 Statistics of sales increase of all lengths of King Long City Buses in the first four months in 2010
It can be seen from above that:
a. Sales of Xiamen Kinglong in the first four months increased 9.09%, nearly 35% lower than bus industry. And the reason for the small growth for city buses lied that sales of 11-12-meter and 10-11-meter buses decreased 50.1% and 7.1%.
b. Sales volumes of Xiamen 8-9-meter city buses increased 39.1%, still less than the average level in bus industry. Thirteen more buses awere in super large city buses, and 169 more in 7-8-meter buses.
c. The comparatively small growth in city bus markets blocked the general growth in overall growth of King Long bus.
