Summarize:www.chinabuses.org:
Analysis of Sales Data of High-class Buses (over RMB 900, 000 Yuan for unit price) in the first 4 months from 2006 to 2010.
Table 1: Sales statistics table of High-class Buses (over RMB900, 000 Yuan for unit price) in the first 4 months in recent 5 years. (Unit: vehicle)
|
The first four months
|
2006
|
2007
|
2008
|
2009
|
2010
|
|
RMB 900.000~1500.000
|
353
|
376
|
422
|
313
|
429
|
|
RMB1500.000~2000.000
|
232
|
246
|
297
|
198
|
312
|
|
over RMB 2000.000
|
143
|
158
|
202
|
167
|
211
|
|
Total
|
728
|
780
|
921
|
678
|
952
|


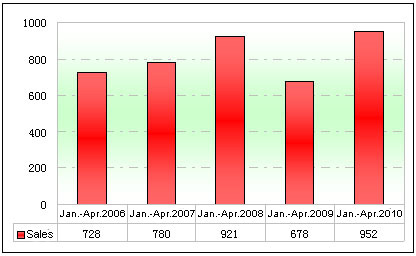
Chart 1: Sales statistics table of High-class Buses (over RMB900, 000 Yuan for unit price) in the first 4 months in recent 5 years.
Shown above:
The sales of high-class buses increases 40.41% in 2010 than that in 2009 and the growth range is the biggest in recent 5 years.
Sales Analysis Based on Price Range
The price of high-class buses is divided into three stages (RMB): 900,000~1500,000 Yuan ; 1500, 000~2000, 000 Yuan ; over 2000,000 Yuan for clear analysis.
1. The sales of the buses valuing RMB900,000~1500,000 Yuan goes up in the first four months from 2006 to 2008. 23 units more in 2007 than in 2006, 6.5% growth; 46 units more in 2008 than in 2007, 12.2% growth; 109 units less in 2009 than in 2008, 25.8% drop; 116 units more in 2010 than in 2009, 37.1% growth, the biggest growth rate in the first 4 months in recent 5 years. (Gloomy market affected by financial crisis in 2009).
Table 2: Sales growth table of Buses (RMB 900,000~1500,000 Yuan for unit price) in the first 4 months in recent 5 years.
|
Year
|
2006
|
2007
|
2008
|
2009
|
2010
|
|
Growth Volume
|
21
|
23
|
46
|
-109
|
116
|
|
Growth Rate
|
6.3
|
6.5
|
12.2
|
-25.8
|
37.1
|
2. The sales of the buses valuing RMB1500,000~2000,000 Yuan goes up in the first four months from 2006 to 2008. 14 units more in 2007 than in 2006, 6.03% growth; 51 units more in 2008 than in 2007, 20.7% growth; 99 units less in 2009 than in 2008, 33.3% drop; 114 units more in 2010 than in 2009, 57.6% growth, the biggest growth rate in the first 4 months in recent 5 years.
Shown above:
The general development rule of bus market in recent 5 years shows: sharpest decline in 2009, steadily increasing over the same period of other 4 years, in particular, the growth rate in 2010. Meanwhile, the absolute amounts of the market demand for RMB1500,000~2000,000 Yuan is far less than that of RMB 900,000~1500,000 Yuan ).
Table 3: Sales growth table of Buses (RMB1500,000~2000,000 Yuan for unit price) in the first 4 months in recent 5 years.
|
Year
|
2006
|
2007
|
2008
|
2009
|
2010
|
|
Growth Volume
|
15
|
14
|
51
|
99
|
114
|
|
Growth Rate
|
6.9
|
6.03
|
20.7
|
-33.3
|
57.6
|
The sales of the buses valuing more than RMB 2000,000 Yuan increasingly goes up in the first four months from 2006 to 2008. 15 units more in 2007 than in 2006, 10.5% growth; 44 units more in 2008 than in 2007, 28.6% growth; 35 units less in 2009 than in 2008, 17.3% drop; 44 units more in 2010 than in 2009, 26.3% growth, the biggest growth rate in the first 4 months in recent 5 years.
Shown above:
The absolute amounts of the market demand for over RMB 2000,000 Yuan is far less than that for RMB 900,000~1500,000 Yuan and that for RMB1500,000~2000,000 Yuan ).
|
Year
|
2006
|
2007
|
2008
|
2009
|
2010
|
|
Growth Volume
|
36
|
15
|
44
|
-35
|
44
|
|
Growth Rate
|
33.6
|
10.5
|
28.6
|
-17.3
|
26.3
|
Table 4: Sales growth table of Buses (RMB1500,000~2000,000 Yuan for unit price) in the first 4 months in recent 5 years.
