Summarize:www.chinabuses.org: Part 3 Sales analysis of coaches on length Jan. to April 2010
Table 5 Sales analysis of coaches on length Jan. to April 2010
|
Length
|
合计
|
12<L
|
11<L≤12
|
10<L≤11
|
9<L≤10
|
|
Coach
|
39798
|
115
|
7343
|
3433
|
1147
|
|
Sleeper Bus
|
1213
|
68
|
1063
|
9
|
0
|
|
Total
|
41011
|
183
|
8406
|
3442
|
1147
|
|
Per cent
|
100
|
0.45
|
20.5
|
8.39
|
2.8
|
|
Length
|
8<L≤9
|
7<L≤8
|
6<L≤7
|
5<L≤6
|
3.5<L≤5
|
|
Coach
|
4957
|
6855
|
6827
|
5964
|
3157
|
|
Sleeper Bus
|
73
|
|
|
|
|
|
Total
|
5030
|
6855
|
6827
|
5964
|
3157
|
|
Per cent
|
12.3
|
16.7
|
16.6
|
14.54
|
7.7
|
It can be seen from above that:
1. Twelve meter above coaches refer to 13.7m super large coaches, and 183 this kind of coaches were sold, taking 0.45% of overall bus sales, so we can find that 13.7m coaches can be found nearly all the bus builders, but it can hardly become the main products in the bus markets. And than it comes 9-10m coaches, 1,147 such buses were sold, taking 2.8% of overall sales. The biggest sales bus model were 11-12m buses, and 8,406 such buses were sold, taking 20.5%, and then it comes 7-8m buses, 6,855 such buses were sold, 16.7% of total sales, and then it is 6-7m buses, 6,827 6-7m buses were sold, taking 16.6% of all sales.
2. Sales of sleeper bus are mainly 11-12m, 1,063 of 11-12m buses were sold, taking 87.6% of all bus sales. Nine 10-11m sleeper buses were sold, 0.74% of sales of sleeper buses. And there are no sales of other sleeper buses, showing that more and more large sleeper buses are popular in markets, and medium sleeper buses have quit from markets.
Part 4 Sales analysis of coaches on price Jan. to April 2010
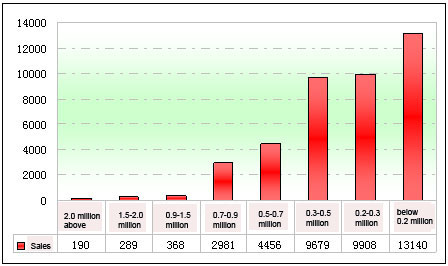
We can see from above that 41,011 coaches were sold in the first four months, and the buses can be divided on price:
Table 6 Sales analysis of coaches on price Jan. to April 2010
|
Price
|
2 million above
|
1.5-2.0 million
|
0.9-1.5 million
|
0.7-0.9 million
|
|
Sales
|
190
|
289
|
368
|
2981
|
|
Per cent
|
0.46
|
0.7
|
0.897
|
7.27
|
|
Price
|
0.5-0.7 million
|
0.3-0.5 million
|
0.2-0.3 million
|
0.2 million below
|
|
Sales
|
4456
|
9679
|
9908
|
13140
|
|
Per cent
|
10.87
|
23.6
|
24.16
|
32.04
|

Figure 2 Sales analysis of coaches on price Jan. to April 2010
It can be seen from above that:
1. Markets needs for coaches below 200,000 RMB is the biggest, these are roughly seven meters below countryside buses, taking 32.04% market share. It means that countryside buses have great potential.
2. Coaches between 200,000 RMB to 300,000 RMB refer to 7-8m products, covering 80-150km transportation and tourism markets, taking 24.16% markets shares, and the sales were 9,908 units, listing the second market needs.
3. Coaches between 300,000 RMB to 500,000 RMB refer to 8-10m products, covering 100-250km transportation and tourism markets, taking 23.6% markets shares, and the sales were 9,679 units, listing the third market needs.
4. Coaches between 500,000 RMB to 700,000 RMB refer to 10-12m products, covering 200-350km transportation and tourism markets, taking 10.87% markets shares, and the sales were 4,456 units, listing the fourth market needs.
5. Coaches between 700,000 RMB to 900,000 RMB refer to 11-12m products, covering 250-400km transportation and tourism markets, taking 7.27% markets shares, and the sales were 2,981 units, listing the fifth market needs.
6. Coaches of more than 900,000 RMB refer to 12m above products, covering 300-500km transportation and tourism markets, taking 2.07% markets shares, and the sales were 847 units, listing the smallest market needs.
7. Sales of market shares of coaches are declining as the prices are increasing, which fit Chinese bus markets rules.
Part 5 Reasons of growth of coaches markets in the first fourth months this year
We have analyzed the coach markets on statistics, and the following analysis will be based on market environments.
1. Sales of coaches in last year were too small.
2. The development of China macro economy is the most important reason to drive the growth. We may find a big growth even compared with the same period in 2008, when production capacity of many bus builders were nearly on full load as the stimulates of the upgrade of Euro 2 to Euro 3. And Chinese bus manufacturers had their own achievement on tourism buses, transit buses and also internal management. So we may contribute this to the improvement of macro economy.
3. The great growth of coaches is the biggest support of the overall growth of sales from January to April this year. Growths of coaches were over 70%, and the figure for city buses were just 44.5%.
4. Growth of large coaches was 90%, which was also contributed growth of coaches.
5. Bus operators looked on last year due to the financial crisis started to buy bus and coaches this year, and it is also a big reason for the growth.
