Summarize:www.chinabuses.org: Part 3 Sales growth of city buses in all lengths in the first five months in 2010 over 2009
1. Sales growth of city buses in all lengths
Table 5 Statistics of sales growth of city buses in all lengths
|
Total
|
12<L
|
11<L≤12
|
10<L≤11
|
9<L≤10
|
|
Jan– May 2010
|
21270
|
353
|
4672
|
4277
|
2531
|
|
Jan– May 2009
|
15438
|
418
|
2884
|
3851
|
2075
|
|
Growth
|
37.8
|
-15.6
|
62
|
11.06
|
21.98
|
| |
8<L≤9
|
7<L≤8
|
6<L≤7
|
5<L≤6
|
3.5<L≤5
|
|
Jan– May 2010
|
3731
|
3493
|
1052
|
830
|
331
|
|
Jan– May 2009
|
2670
|
2262
|
1112
|
166
|
0
|
|
Growth
|
39.74
|
54.42
|
-5.4
|
400
|
100
|

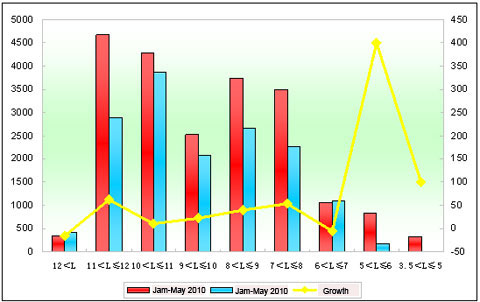
Figure 5 Statistics of sales growth of city buses in all lengths
It can be seen from above that sales of city buses increased 37.8% in the first five months, nearly 7% less than that of the first four months. As to lengths, only sales of 6-7m and super large buses decreased. And biggest growth was 5-6m, and then it comes to 11-12m, 7-8m, showing that sales growth of 5-6m countryside buses and 11-12m super large buses are the main factor for the growth of bus sales.
2. Higer city buses
Table 6 Statistics of Yutong city buses sales growth in all lengths in the first five months
|
Total
|
12<L
|
11<L≤12
|
10<L≤11
|
|
Jan– May 2010
|
1852
|
6
|
343
|
664
|
|
Jan– May 2009
|
973
|
0
|
3
|
30
|
|
Growth
|
90.34
|
100
|
113.33
|
2113
|
|
Growth in bus industry
|
37.8
|
-15.6
|
62
|
11.06
|
| |
9<L≤10
|
8<L≤9
|
7<L≤8
|
|
|
Jan– May 2010
|
184
|
406
|
249
|
|
|
Jan– May 2009
|
655
|
217
|
68
|
|
|
|
-183.1
|
87.1
|
266.2
|
|
|
Growth in bus industry
|
21.98
|
39.74
|
54.42
|
|

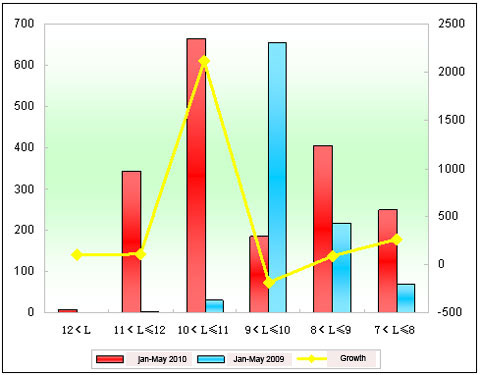
Figure 6 Statistics of Higer city buses sales growth in all lengths in the first five months
It can be seen from above that:
1. Higer sold 1,852 buses in the first five months, 879 units more than last year, up 90.34%, and 53% higher than that of industry average growth. It shows that growth in city buses were the main reason to drive the overall growth of Higer bus.
2. Sales growth of Higer bus are mainly 11-12m, 10-11m, 8-9m, 7-8m, especially sales growth of 11-12m and 10-11m were far more higher than bus industry. It means that sales of city buses were the main factor to drive overall growth of Higer Bus.
3. Sales of 9-10m Higer buses was the only decreasing length. However sales of super large buses were six units more than previous years.
