Summarize:www.chinabuses.org:
2. Higer Seat Buses
Table 4: Sales Growth Statistics Table of Higer Seat Buses in various lengths for buses in Jan.-Jun. 2010
| |
Total
|
12<L
|
11<L≤12
|
10<L≤11
|
9<L≤10
|
|
Jan.-Jun.,2010
|
6939
|
26
|
1582
|
895
|
116
|
|
Jan.-Jun.,2009
|
4919
|
35
|
640
|
133
|
716
|
|
Year-on-year growth
|
41.1
|
-25.7
|
147.2
|
572.9
|
-83.8
|
|
Industry growth
|
60.24
|
-47.5
|
98.14
|
59.01
|
5.57
|
| |
8<L≤9
|
7<L≤8
|
6<L≤7
|
5<L≤6
|
|
|
Jan.-Jun.,2010
|
1358
|
1619
|
136
|
1207
|
|
|
Jan.-Jun.,2009
|
792
|
1477
|
1126
|
0
|
|
|
|
71.5
|
9.6
|
-8.8
|
100
|
|
|
Industry growth
|
61.4
|
48.13
|
27.8
|
151.9
|
|

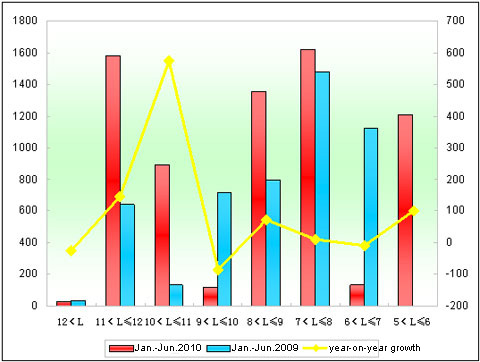
Chart 4: Sales Growth Statistics Chart of Higer Seat Buses in various lengths for buses in Jan. - Jun. 2010
Shown above,
① The sales of Higer seat buses overall increases 41.1% in various lengths, almost 20 percentage less than the growth rate of the industry and about 8 percentage less than that of the general growth of the bus market. It indicates that the growth of Higer seat buses increasingly slows down in the first half of 2010 and the growth of seat buses is not the main reason for that of the Higer.
② The sales of Higer seat buses for 11-12 meter grows 147.2% in Jan.-Jun.2010, far higher than the growth rate of the industry. It tells that Higer is heading to the large-sized bus industry and has made preliminary progress. The growth range of 10-11 meter buses reaches 572.9%, more almost 513 percentage than that of the industry. It indicates that the position of Higer 10-11 meter seat buses is strengthening.
Analysis of Sales Growth of City Buses in Various Lengths in Jan.-May 2010 and Jan.-Jun. 2009
1. The Sales Growth of City Buses in Various Lengths for the Bus Industry
Table 5: Sales Growth Statistics Table of City Buses in various lengths for buses in Jan. - Jun. 2010
| |
Total
|
12<L
|
11<L≤12
|
10<L≤11
|
9<L≤10
|
|
Jan.-Jun.,2010
|
26544
|
520
|
5898
|
5646
|
3339
|
|
Jan.-Jun.,2009
|
20402
|
466
|
3643
|
5379
|
2569
|
|
Year-on-year growth
|
30.1
|
11.59
|
61.9
|
4.96
|
29.97
|
| |
8<L≤9
|
7<L≤8
|
6<L≤7
|
5<L≤6
|
3.5<L≤5
|
|
Jan.-Jun.,2010
|
4418
|
4156
|
1274
|
909
|
384
|
|
Jan.-Jun.,2009
|
3565
|
3109
|
1472
|
199
|
0
|
|
Year-on-year growth
|
23.93
|
33.7
|
-13.45
|
356.8
|
100
|

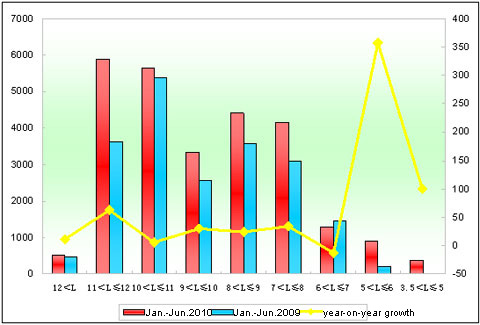
Chart 5: Sales Growth Statistics Chart of City Buses in various lengths for buses in Jan. - Jun. 2010
Shown above,
The sales of city buses increases 30.10% in the first half of 2010, and the growth rate is lower than that of previous several months, less than that of the overall growth. It indicates that the growth of seat buses rather than city buses lead to the big growth range of bus market in Jan.-Jun., 2010. In lengths, the sales of buses at all lengths show positive growth, apart from 6-7 meter, in particular, the growth of 5-6 meter buses exceeds over 300%. However, the base is small and the absolute figure is not big. The growth rate of 11-12 meter large buses reaches 61.9%. It tells that the demand of artery routes in large and medium cities is still the main theme of the city bus demand in the first half of 2010, especially extra large-sized buses positively grows.
2. Higer Buses
Table 6: Sales Growth Statistics Table of Higer City Buses in various lengths for buses in Jan.-Jun. 2010
|
|
Total
|
12<L
|
11<L≤12
|
10<L≤11
|
|
Jan.-Jun.,2010
|
3158
|
70
|
1022
|
511
|
|
Jan.-Jun.,2009
|
2275
|
89
|
739
|
234
|
|
Year-on-year growth
|
38.8
|
-21.35
|
38.29
|
118.4
|
|
Industry growth
|
30.1
|
11.59
|
61.9
|
4.96
|
| |
9<L≤10
|
8<L≤9
|
7<L≤8
|
|
|
Jan.-Jun.,2010
|
309
|
612
|
634
|
|
|
Jan.-Jun.,2009
|
302
|
456
|
455
|
|
|
|
2.3
|
34.2
|
39.3
|
|
|
Industry growth
|
29.97
|
23.93
|
33.7
|
|

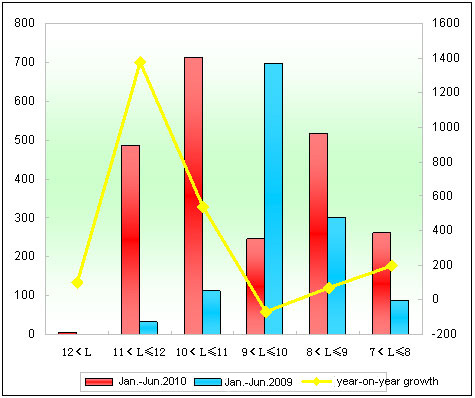
Chart 6: Sales Growth Statistics Chart of Higer City Buses in various lengths for buses in Jan. - Jun. 2010
Shown above,
① The sales volume of Higer city buses is 2231 units in Jan.-Jun.,2010, more 1001 units than Jan.-Jun., 2009, year-on-year growth of 81.4%, more almost 50 percentage than that of the industry.
② The growth of Higer city buses mainly show at the lengths of 10-11 meter (600 units more); 11-12 meter (454 units more) and 7-8 meter (173 units more).
