Summarize:www.chinabuses.org:
Analysis of Sales Growth of Bus Industry in Jan. - Jul. 2010 and Jan. - Jul. 2009
1. Sales Growth in Various Lengths
Table 1: Sales Growth Statistics Table in various lengths for buses in Jan.- Jul 2010
| |
Total
|
12<L
|
11<L≤12
|
10<L≤11
|
9<L≤10
|
|
Jan.-Jul. 2010
|
108939
|
1132
|
21298
|
13135
|
6409
|
|
Jan.-Jul. 2009
|
74279
|
960
|
12305
|
10448
|
5658
|
|
Year-on-year growth
|
46.7
|
17.9
|
73.1
|
25.7
|
13.3
|
| |
8<L≤9
|
7<L≤8
|
6<L≤7
|
5<L≤6
|
3.5<L≤5
|
|
Jan.-Jul. 2010
|
14153
|
17369
|
14998
|
13664
|
6781
|
|
Jan.-Jul. 2009
|
9848
|
12797
|
12840
|
5173
|
4250
|
|
|
43.7
|
35.7
|
16.8
|
164.1
|
59.6
|
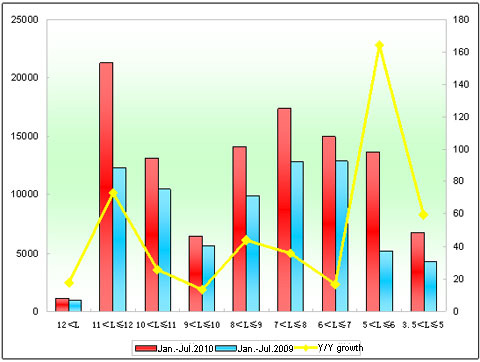
Chart 1: Sales Growth Statistics Table in various lengths for buses in Jan. - Jul 2010
Shown above,
The sales goes up 46.7% in Jan. - Jul., 2010 than Jan. - Jul., 2009. In lengths, the sales of buses in all lengths increase, which is the seventh successive growth after Jul. 2010. It indicates that the positive influence of national good economic development is still making on the bus market, however, the growth rate slightly decreases compared with previous months (It is less than 50% for the first time in 2010). The biggest growth show at 5-6 meter (164.1%), and then 11-12 meter (73.1%), 8-9 meter (43.7%), longer than 12-meter (17.9%), 6-7 meter (16.8%) and 9-10 meter (the smallest growth).
2. Analysis of Sales Growth of Higer Bus in Various Lengths
Table 2: Sales Growth Statistics Table of Higer Bus in various lengths for buses in Jan.- Jul. 2010
|
|
Total
|
12<L
|
11<L≤12
|
10<L≤11
|
9<L≤10
|
|
Jan.-Jul. 2010
|
10966
|
38
|
2675
|
1907
|
393
|
|
Jan.-Jul. 2009
|
7258
|
38
|
907
|
267
|
1659
|
|
Year-on-year growth
|
51.1
|
0
|
194.9
|
614.2
|
-76.3
|
|
Industry growth
|
46.7
|
17.9
|
73.1
|
25.7
|
13.3
|
| |
8<L≤9
|
7<L≤8
|
6<L≤7
|
5<L≤6
|
|
|
Jan.-Jul. 2010
|
2164
|
2267
|
143
|
1379
|
|
|
Jan.-Jul. 2009
|
1210
|
1883
|
1294
|
0
|
|
|
|
78.8
|
20.4
|
-88.9
|
100
|
|
|
Industry growth
|
43.7
|
35.7
|
16.8
|
164.1
|
|
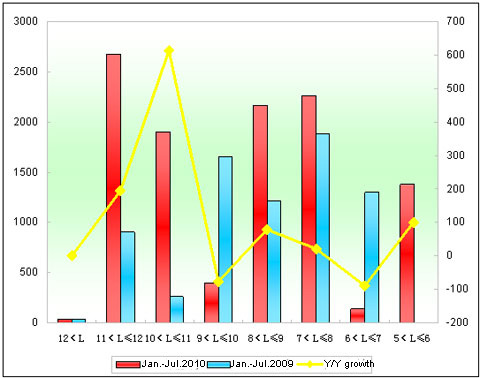
Chart 2: Sales Growth Statistics Table of Higer Bus in various lengths for buses in Jan. - Jul. 2010
Shown above,
① The growth range of Higer comes to 51.1% in Jan. - Jul., 2010, less almost 4.4 percentage than that of industry. In lengths of buses, it grows 194.9% for 11-12 meter, almost 122 percentage than that of the industry (73.1%), but the decreasing rate of 9-10 meter is obviously higher than that of industry, and zero sales for extra large bus. It tells that the product structure of Higer is comparatively reasonable. Higer is making effort to surpass the leading China bus builder, however, its traditional advantages in weakening for 9-10 meter buses.
② The sales growth of 10-11 meter buses reaches 614.2%, far higher than that of the industry (25.7%), and this length is the segment market with the biggest growth, contributing a lot to the overall growth of Higer.
Analysis of Sales Growth of Seat Buses in Jan.-Jul. 2010 and Jan. - Jul. 2009
1. Sales Growth of Seat Buses in the Bus Industry
Table 3: Sales Growth Statistics Table of Seats Buses in various lengths for buses in Jan. - Jul .2010
|
|
Total
|
12<L
|
11<L≤12
|
10<L≤11
|
9<L≤10
|
|
Jan.-Jul.2010
|
75727
|
187
|
12848
|
6276
|
2557
|
|
Jan.-Jul.2009
|
48057
|
333
|
6584
|
3957
|
2345
|
|
Year-on-year growth
|
57.6
|
-43.8
|
95.1
|
58.6
|
9
|
| |
8<L≤9
|
7<L≤8
|
6<L≤7
|
5<L≤6
|
3.5<L≤5
|
|
Jan.-Jul.2010
|
9048
|
12551
|
13449
|
12468
|
6343
|
|
Jan.-Jul.2009
|
5598
|
9113
|
10921
|
4956
|
4250
|
|
|
61.6
|
37.7
|
23.1
|
151.6
|
49.2
|
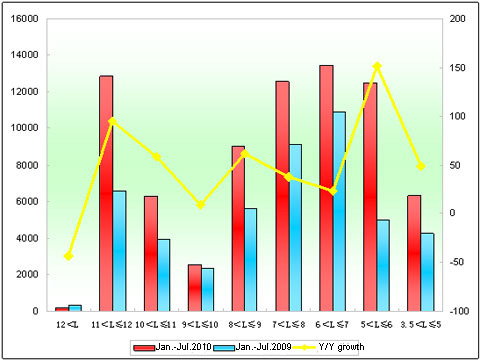
Chart 3: Sales Growth Statistics Table of Seats Buses in various lengths for buses in Jan. - Jul. 2010
Shown above,
The sales goes up 57.6% for seat buses in Jan.-Jul.2010,and growth rate slightly lowing than that in first half of 2010 . In lengths, it only reduces in extra large buses, while all increase in other lengths, especially 5-6 meter, and then 11-12 meter, and 8-9 meter. The smallest growth shows in 9-10 meter buses. It indicates that the sales increasing of seat buses is main factors for the growth of the general bus market in the first seven months in 2010 and the positive influence of national good economic development is still making on the seat bus market in Jan.-Jul.2010.
2. Higer Seat Buses
Table 4: Sales Growth Statistics Table of Higer Seat Buses in various lengths for buses in Jan.-Jul. 2010
|
|
Total
|
12<L
|
11<L≤12
|
10<L≤11
|
9<L≤10
|
|
Jan.-Jul.2010
|
8117
|
29
|
1886
|
1077
|
128
|
|
Jan.-Jul.2009
|
5669
|
38
|
744
|
150
|
790
|
|
Year-on-year growth
|
43.2
|
-23.7
|
153.5
|
618
|
-83.8
|
|
Industry growth
|
57.6
|
-43.8
|
95.1
|
58.6
|
9
|
| |
8<L≤9
|
7<L≤8
|
6<L≤7
|
5<L≤6
|
|
|
Jan.-Jul.2010
|
1540
|
1935
|
143
|
1379
|
|
|
Jan.-Jul.2009
|
891
|
1762
|
1294
|
0
|
|
|
|
72.8
|
9.8
|
-88.9
|
100
|
|
|
Industry growth
|
61.6
|
37.7
|
23.1
|
151.6
|
|
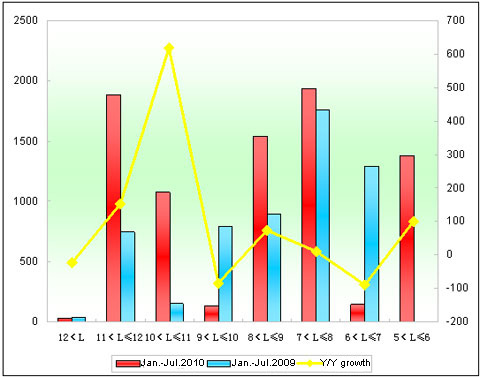
Chart 4: Sales Growth Statistics Chart of Higer Seat Buses in various lengths for buses in Jan. - Jul. 2010
Shown above,
① The sales of Higer seat buses overall increases 43.2% in various lengths, almost 14 percentage less than the growth rate of the industry and about 8 percentage less than that of the general growth of the bus market. It indicates that the growth of Higer seat buses increasingly slows down in the first seven months of 2010 and the growth of seat buses is not the main reason for that of the Higer.
② The sales of Higer seat buses for 11-12 meter grows 153.5% in Jan.-Jul.2010, far higher than the growth rate of the industry (95.1%). It tells that Higer is heading to the large-sized bus industry and has made preliminary progress. The decreasing range of 9-10 meter buses reaches 83.8% while growth of 9.0% in the industry. It indicates that the traditional advantage of Higer 9-10 meter seat buses is decreasing to a big degree.
③ The growth speed of sales of 11-12 meter, 10-11 meter and longer above 12-meter is higher than that of industry, in particular, 10-11 meter, contributing to the growth of Higer seat buses.
Analysis of Sales Growth of City Buses in Various Lengths in Jan.-Jul. 2010 and Jan.-Jul. 2009
1. The Sales Growth of City Buses in Various Lengths for the Bus Industry
Table 5: Sales Growth Statistics Table of City Buses in various lengths for buses in Jan. - Jul. 2010
|
|
Total
|
12<L
|
11<L≤12
|
10<L≤11
|
9<L≤10
|
|
Jan.-Jul.2010
|
30907
|
846
|
6657
|
6843
|
3816
|
|
Jan.-Jul.2009
|
24667
|
459
|
4453
|
6481
|
3310
|
|
Year-on-year growth
|
25.3
|
84.3
|
49.5
|
5.6
|
15.3
|
| |
8<L≤9
|
7<L≤8
|
6<L≤7
|
5<L≤6
|
|
|
Jan.-Jul.2010
|
5093
|
4793
|
1384
|
1037
|
|
|
Jan.-Jul.2009
|
4238
|
3684
|
1825
|
217
|
|
|
Year-on-year growth
|
20.2
|
30.1
|
-24.2
|
377.9
|
|
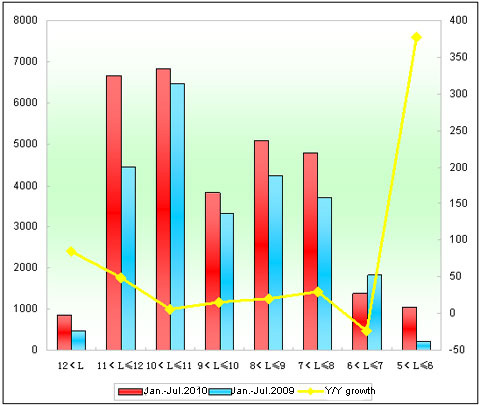
Chart 5: Sales Growth Statistics Chart of City Buses in various lengths for buses in Jan. – Jul. 2010
Shown above,
The sales of city buses increases 25.3% in Jan.-Jul.2010, and the growth rate is lower than that of previous several months. In lengths, the sales of buses at all lengths show positive growth, apart from 6-7 meter with rate of 24.2%, in particular, the growth of 5-6 meter buses comes to 377.9%. The growth range of above 12-meter buses reaches 84.3% and of 11-12 meter comes to 49.5%.
2. Higer City Buses
Table 6: Sales Growth Statistics Table of Higer City Buses in various lengths for buses in Jan.-Jul. 2010
|
|
Total
|
12<L
|
11<L≤12
|
10<L≤11
|
|
Jan.-Jul.2010
|
2747
|
6
|
690
|
830
|
|
Jan.-Jul.2009
|
1521
|
0
|
95
|
117
|
|
Year-on-year growth
|
80.6
|
100
|
626.3
|
609.4
|
|
Industry growth
|
25.3
|
84.3
|
49.5
|
5.6
|
| |
9<L≤10
|
8<L≤9
|
7<L≤8
|
|
|
Jan.-Jul.2010
|
265
|
624
|
332
|
|
|
Jan.-Jul.2009
|
869
|
319
|
121
|
|
|
|
-69.5
|
95.6
|
174.4
|
|
|
Industry growth
|
15.3
|
20.2
|
30.1
|
|
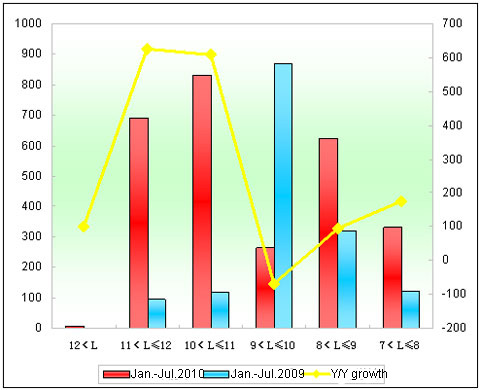
Chart 6: Sales Growth Statistics Chart of Higer City Buses in various lengths for buses in Jan. - Jul. 2010
Shown above,
① The sales volume of Higer city buses is 2747 units in Jan.-Jul.,2010, more 1226 units than Jan.-Jul., 2009, year-on-year growth of 80.6%, more almost 55 percentage than that of the industry.
② The growth of Higer city buses mainly show at the lengths of 10-11 meter (713 units more, Y/Y growth of 609.4%); 11-12 meter (595 units more, Y/Y growth of 626.3%) and 8-9 meter (305 units more, Y/Y growth of 95.6%).
③ The sales of Higer 9-10 meter buses decreases with rate of 69.5% while positive growth of counterpart in the industry with rate of 15.3%.
