Summarize:www.chinabuses.org: Part 3 Sales growth of city buses in all lengths in the first seven months in 2010 over 2009
1. Sales growth of city buses in all lengths
Table 5 Statistics of sales growth of city buses in all lengths
|
|
Total
|
12<L
|
11<L≤12
|
10<L≤11
|
9<L≤10
|
|
Jan–July 2010
|
30907
|
846
|
6657
|
6843
|
3816
|
|
Jan–July 2009
|
24667
|
459
|
4453
|
6481
|
3310
|
|
Growth
|
25.3
|
84.3
|
49.5
|
5.6
|
15.3
|
| |
8<L≤9
|
7<L≤8
|
6<L≤7
|
5<L≤6
|
|
|
Jan–July 2010
|
5093
|
4793
|
1384
|
1037
|
|
|
Jan–July 2010
|
4238
|
3684
|
1825
|
217
|
|
|
Growth
|
20.2
|
30.1
|
-24.2
|
377.9
|
|

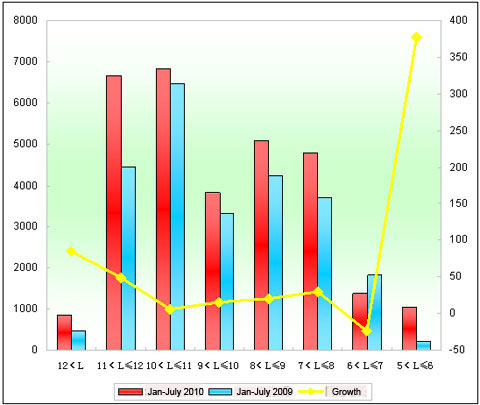
Figure 5 Statistics of sales growth of city buses in all lengths
It can be seen from above that sale of city buses increased by 25.3% in the first seven months, nearly 5% less than the growth in the first six months. The continuous growths of city buses are a reflection of national policies support. We can see that it was the main factor to drive growth of bus markets in the first seven months. As to lengths, only sales of 6-7m buses decreased. And biggest growth was 5-6m, up over 377.9%, and then it comes to 12m above coaches, up 84.3%, and 11-12m coaches, up 49.5%.
2. Zherngzhou Yutong city buses
Table 6 Statistics of Yutong city buses sales growth in all lengths in the first seven months
|
|
Total
|
12<L
|
11<L≤12
|
10<L≤11
|
|
Jan–July 2010
|
3952
|
70
|
1242
|
691
|
|
Jan–July 2009
|
2648
|
89
|
897
|
313
|
|
|
49.2
|
-21.3
|
38.5
|
120.7
|
|
Growth in industry
|
25.3
|
84.3
|
49.5
|
5.6
|
| |
9<L≤10
|
8<L≤9
|
7<L≤8
|
|
|
Jan–July 2010
|
405
|
829
|
715
|
|
|
Jan–July 2009
|
405
|
458
|
486
|
|
|
|
0
|
81
|
47.1
|
|
|
Growth in industry
|
15.3
|
20.2
|
30.1
|
|

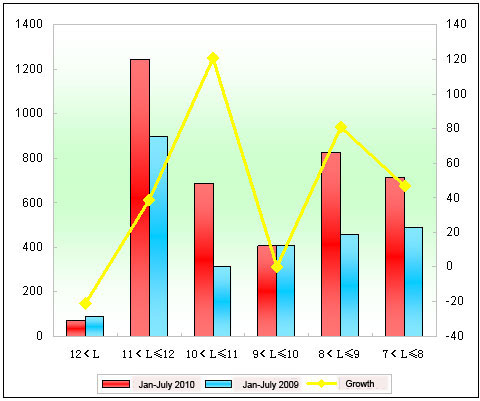
Figure 6 Statistics of Yutong city buses sales growth in all lengths in the first seven months
1. Sales of Yutong city buses increased 49.2%, 9..6% higher than that of the first half year, but nearly 14% more than its overall growth, and we can see that the growth of city buses can drive its overall growth, but it was the main factor for the overall growth.
2. 345 Yutong 11-12m city buses were sold out, up 38.5%, nearly 11% less than that of average bus industry, 49.5%; while sales of super large buses decreased 21.3%, and sales of super large buses were increasing in bus industry.
3. Sales of 9-10m city buses were increasing, while the figures in bus industry increased by 15.3%, and the biggest growth were 10-11m, up 120.7%, 115% higher than the growth of bus industry.
Part 4 Sales growth of Yutong sleeper buses in all lengths in the first seven months in 2010 over 2009
1. 1. Sales growth of Yutong sleeper buses in all lengths
Table 7 Statistics of sales growth of Yutong sleeper buses in all lengths in the first seven months
|
|
Total
|
12<L
|
11<L≤12
|
10<L≤11
|
|
Jan–July 2010
|
1907
|
98
|
1793
|
16
|
|
Jan–July 2009
|
1445
|
167
|
1268
|
10
|
|
Growth
|
32
|
-41.3
|
41.4
|
60
|
It can be seen from above that:
Sales of sleeper buses were increasing in the first seven months over 2009, up 32.0%, less than that of the first six months. And 11-12m sleeper buses increased the most, and the units were 525. We can also find that sales of sleeper buses were less than coaches, but higher than city buses.
3. Zhengzhou Yutong sleeper bus
Table 8 Statistics of sales growth of Yutong sleeper buses in the first seven months 2010
|
|
Total
|
12<L
|
11<L≤12
|
|
Jan–July 2010
|
989
|
26
|
963
|
|
Jan–July 2010
|
748
|
32
|
716
|
|
Growth
|
32.2
|
-18.8
|
34.5
|
|
Growth in industry
|
32
|
-41.3
|
41.4
|
It can be seen from above that:
Yutong sleeper bus is in monopoly in the sleeper bus markets, and 1,907 sleeper buses were sold out, 989 of them were sold by Yutong, taking 51.9% market share, up 32.2% over last year.
1. We can also find that their sales of sleeper buses were 989 units last year, taking 51.9% markets share, and their market share last year were 51.8%. We can see that Yutong’s monopoly position is strengthening slightly.
2. Sales of Yutong sleeper buses were mainly 11-12m, medium buses have been eliminated, and there were 26 12m above sleeper buses were sold out, down 18.8% than last year.
