Summarize:
2. Youngman Seat Buses
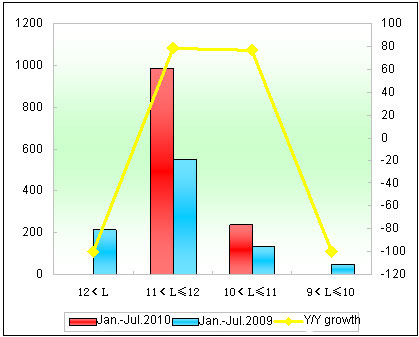
Table 4: Sales Growth Statistics Table of Youngman Seat Buses in various lengths for buses in Jan.-Jul. 2010
| |
Total
|
12<L
|
11<L≤12
|
|
Jan.-Jul.2010
|
1221
|
0
|
985
|
|
Jan.-Jul.2009
|
951
|
216
|
553
|
|
Year-on-year growth
|
28.4
|
-100
|
78.1
|
|
Industry growth
|
57.6
|
-43.8
|
95.1
|
| |
10<L≤11
|
9<L≤10
|
|
|
Jan.-Jul.2010
|
236
|
0
|
|
|
Jan.-Jul.2009
|
134
|
48
|
|
|
|
76.1
|
-100
|
|
|
Industry growth
|
58.6
|
9
|
|

Chart 4: Sales Growth Statistics Chart of Youngman Seat Buses in various lengths for buses in Jan. - Jul. 2010
Shown above,
① The sales of Youngman Bus seat buses overall increases 28.4% in various lengths, almost 28.2 percentage less than the growth rate of the industry and about 6 percentage less than that of its general growth . It indicates that the growth of Youngman seat buses slows down in the first seven months of 2010 and the growth of seat buses is not the main reason for that of Youngman Bus.
② The sales of Youngman seat buses for 10-11 meter grows 76.1% and 78.1% for 11-12 meter in Jan.-Jul.2010. It shows negative growth at other lengths and tells that the growth of various Youngman seat buses is not in balance. In addition, Youngman Bus got zero sales for extra large seat buses in Jan.-Jul.2010 while 216 units in Jan.-Jul.2009.
Analysis of Sales Growth of City Buses in Various Lengths in Jan.-Jul. 2010 and Jan.-Jul. 2009
1. The Sales Growth of City Buses in Various Lengths for the Bus Industry
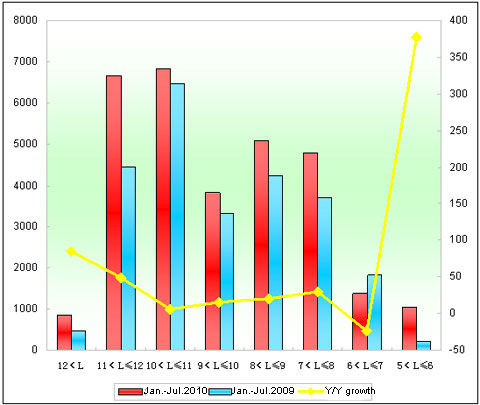
Table 5: Sales Growth Statistics Table of City Buses in various lengths for buses in Jan. - Jul. 2010
| |
Total
|
12<L
|
11<L≤12
|
10<L≤11
|
9<L≤10
|
|
Jan.-Jul.2010
|
30907
|
846
|
6657
|
6843
|
3816
|
|
Jan.-Jul.2009
|
24667
|
459
|
4453
|
6481
|
3310
|
|
Year-on-year growth
|
25.3
|
84.3
|
49.5
|
5.6
|
15.3
|
| |
8<L≤9
|
7<L≤8
|
6<L≤7
|
5<L≤6
|
|
|
Jan.-Jul.2010
|
5093
|
4793
|
1384
|
1037
|
|
|
Jan.-Jul.2009
|
4238
|
3684
|
1825
|
217
|
|
|
Year-on-year growth
|
20.2
|
30.1
|
-24.2
|
377.9
|
|

Chart 5: Sales Growth Statistics Chart of City Buses in various lengths for buses in Jan. – Jul. 2010
Shown above,
The sales of city buses increases 25.3% in Jan.-Jul.2010, and the growth rate is lower than that of previous several months. In lengths, the sales of buses at all lengths show positive growth, apart from 6-7 meter with rate of 24.2%, in particular, the growth of 5-6 meter buses comes to 377.9%. The growth range of above 12-meter buses reaches 84.3% and of 11-12 meter comes to 49.5%.
2.Youngman City Buses
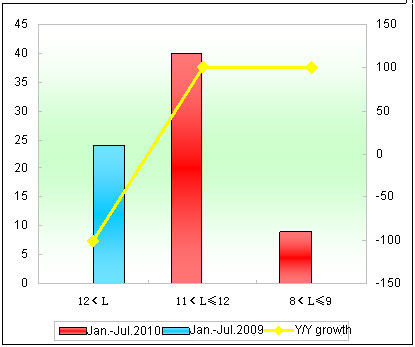
Table 6: Sales Growth Statistics Table of Youngman City Buses in various lengths for buses in Jan.-Jul. 2010
| |
Total
|
12<L
|
11<L≤12
|
10<L≤11
|
|
Jan.-Jul.2010
|
3952
|
70
|
1242
|
691
|
|
Jan.-Jul.2009
|
2648
|
89
|
897
|
313
|
|
Year-on-year growth
|
49.2
|
-21.3
|
38.5
|
120.7
|
|
Industry growth
|
25.3
|
84.3
|
49.5
|
5.6
|
| |
9<L≤10
|
8<L≤9
|
7<L≤8
|
|
|
Jan.-Jul.2010
|
405
|
829
|
715
|
|
|
Jan.-Jul.2009
|
405
|
458
|
486
|
|
|
|
0
|
81
|
47.1
|
|
|
Industry growth
|
15.3
|
20.2
|
30.1
|
|

Chart 6: Sales Growth Statistics Chart of Youngman City Buses in various lengths for buses in Jan.-Jul. 2010
Shown above,
① The sales volume of Youngman city buses grows 104.2% in the first seven months while 25.3% in the industry in the same period of time. The growth of 11-12 meter city buses (40 units more) contributes to the growth of city buses while zero in last year. It sells nine 8-9 meter city buses while zero in last year.
② The market shares of Youngman city buses is 3.15% and highway buses is 96.85%. It tells that the main market for Youngman Bus is highway market not city bus one.
Analysis of Sales Growth of Sleeper Buses in Various Lengths in Jan.-Jul. 2010 and Jan.-Jul. 2009
1. The Sales Growth of Sleeper Buses in Various Lengths for the Bus Industry
Table 7: Sales Growth Statistics Table of Sleeper Buses in various lengths for buses in Jan.-Jul. 2010
|
|
Total
|
12<L
|
11<L≤12
|
10<L≤11
|
|
Jan.-Jul.2010
|
1907
|
98
|
1793
|
16
|
|
Jan.-Jul.2009
|
1445
|
167
|
1268
|
10
|
|
Year-on-year growth
|
32
|
-41.3
|
41.4
|
60
|
Shown above,
In Jan.-Jul.2010, the year-on-year growth of sleeper buses reaches 32.0% and the growth of sleeper buses comes to 37.05%. The biggest growth shows at 11-12 meter buses (525 units).
2. Youngman Sleeper Buses
Table 8: Sales Growth Statistics Table of Youngman Sleeper Buses in various lengths for buses in Jan.-Jul. 2010
|
|
Total
|
12<L
|
11<L≤12
|
|
Jan.-Jul.2010
|
199
|
15
|
184
|
|
Jan.-Jul.2009
|
178
|
64
|
114
|
|
Year-on-year growth
|
11.8
|
-76.6
|
61.4
|
|
Industry growth
|
32
|
-41.3
|
41.4
|
Shown above,
① The growth of Youngman sleeper buses reaches 11.8% in the first seven months, less than industry growth range.
② The growth mainly shows at 11-12 meter buses (61.4%).
③ Extra large sleeper buses are the traditional advantageous models for Youngman Bus, however, the sales decreases to big degree (76.6%).
