Summarize:
www.chinabuses.org:
Analysis of Sales Growth of Bus Industry in Jan. - Aug. 2010 and Jan. - Aug. 2009
1. Sales Growth in Various Lengths
Table 1: Sales Growth Statistics Table in various lengths for buses in Jan.- Aug. 2010
|
|
Total
|
12<L
|
11<L≤12
|
10<L≤11
|
9<L≤10
|
|
Jan. - Aug. 2010
|
127204
|
1057
|
25812
|
15300
|
7586
|
|
Jan. - Aug. 2009
|
89636
|
1140
|
15119
|
12401
|
6815
|
|
Year-on-year Growth
|
42.13
|
-7.28
|
70.73
|
23.38
|
11.3
|
| |
8<L≤9
|
7<L≤8
|
6<L≤7
|
5<L≤6
|
3.5<L≤5
|
|
Jan. - Aug. 2010
|
16317
|
20082
|
17435
|
15495
|
8120
|
|
Jan. - Aug. 2009
|
11648
|
15246
|
15890
|
6236
|
5141
|
|
|
40.08
|
31.72
|
9.72
|
148.4
|
57.95
|

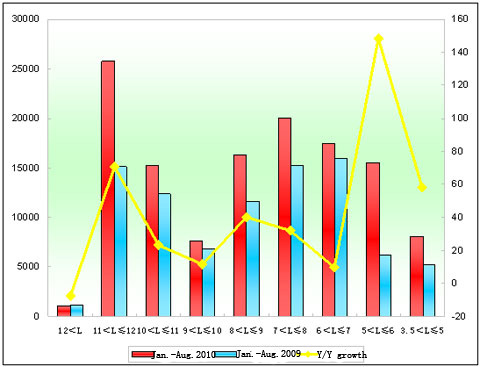
Chart 1: Sales Growth Statistics Table in various lengths for buses in Jan. - Jul 2010
The sales goes up 42.13% in Jan. - Aug., 2010 than Jan. - Aug., 2009. In lengths, the sales of buses in all lengths increase, which is the eighth successive growth after the first seven months in 2010, apart from extra large buses. However, the growth rate slightly decreases compared with previous months. The biggest growth show at 5-6 meter, and then 11-12 meter, 3.5-5 meter, 6-7 meter,10-11 meter,9-10 meter and 6-7 meter(the smallest growth).
2. Analysis of Sales Growth of King Long Bus in Various Lengths
Table 2: Sales Growth Statistics Table of King Long Bus in various lengths for buses in Jan. - Aug. 2010
|
|
Total
|
12<L
|
11<L≤12
|
10<L≤11
|
9<L≤10
|
|
Jan.-Aug.2010
|
14491
|
47
|
3003
|
1878
|
463
|
|
Jan.-Aug.2009
|
7964
|
34
|
2513
|
972
|
363
|
|
Year-on-year Growth
|
81.96
|
38.24
|
19.5
|
93.2
|
27.55
|
|
Industry Growth
|
42.13
|
-7.28
|
70.73
|
23.38
|
11.3
|
| |
8<L≤9
|
7<L≤8
|
6<L≤7
|
5<L≤6
|
|
|
Jan.-Aug.2010
|
1817
|
1065
|
460
|
5758
|
|
|
Jan.-Aug.2009
|
1403
|
827
|
0
|
1852
|
|
|
|
29.5
|
28.8
|
100
|
210.91
|
|
|
Industry Growth
|
40.08
|
31.72
|
9.72
|
148.4
|
|

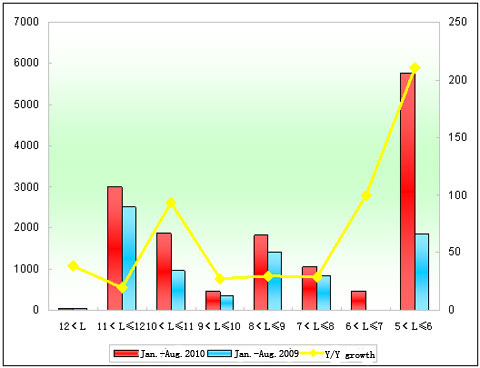
Chart 2: Sales Growth Statistics Table of King Long Bus in various lengths for buses in Jan. - Aug. 2010
Shown above,
① The sales increase 6527 units (growth rate:81.96%) in Jan.-Aug.2010 than Jan.-Aug.2009, almost higher 40 percentage than the growth speed of the industry.
② It shows growth (210.91%) at 5-6 lengths (3906 units).
③ The growth speed of King Long Bus is the highest during Yutong,King Long, Higer and Golden Dragon, in particular, 11-12 meter buses (ranking the third in the industry, second to Yutong and Higer).This length is also the traditionally advantageous one for Yutong.
④The sales volume of extra large King Long buses is 47 units, 13 more ones than last year while negative growth in the industry.
Analysis of Sales Growth of Seat Buses in Jan.-Aug.2010 and Jan. - Aug.2009
1. Sales Growth of Seat Buses in the Bus Industry
Table 3: Sales Growth Statistics Table of Seats Buses in various lengths for buses in Jan. - Aug.2010
|
|
Total
|
12<L
|
11<L≤12
|
10<L≤11
|
9<L≤10
|
|
Jan.-Aug.2010
|
88238
|
243
|
15273
|
7245
|
3139
|
|
Jan.-Aug.2009
|
57981
|
416
|
7711
|
4727
|
2842
|
|
Year-on-year Growth
|
52.18
|
-41.59
|
98.07
|
53.27
|
10.45
|
| |
8<L≤9
|
7<L≤8
|
6<L≤7
|
5<L≤6
|
3.5<L≤5
|
|
Jan.-Aug.2010
|
10557
|
14427
|
15610
|
14084
|
7660
|
|
Jan.-Aug.2009
|
6620
|
10905
|
13618
|
6001
|
5141
|
|
|
59.47
|
32.3
|
14.63
|
134.69
|
49
|

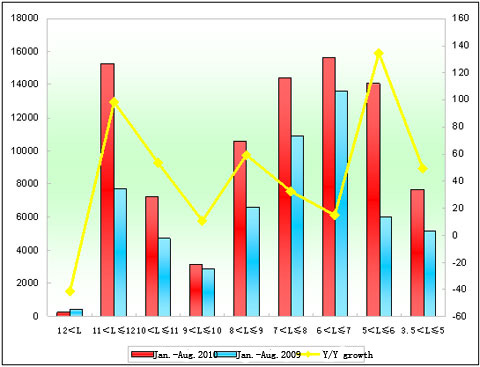
Chart 3: Sales Growth Statistics Table of Seats Buses in various lengths for buses in Jan. - Aug.2010
Shown above,
The sales goes up 52.18% for seat buses in Jan.-Aug.2010, and growth rate slightly is higher than that in overall bus market. In lengths, it only reduces in extra large buses, while all increase in other lengths, especially 5-6 meter, and then 11-12 meter, and 8-9 meter. The smallest growth shows in 9-10 meter buses (extra large buses dropping) and 6-7 meter. It indicates that the sales increasing of seat buses is main factors for the growth of the general bus market in the first eight months in 2010 and the positive influence of national good economic development is still making on the seat bus market in Jan.-Aug.2010.
