Summarize:www.chinabuses.org:
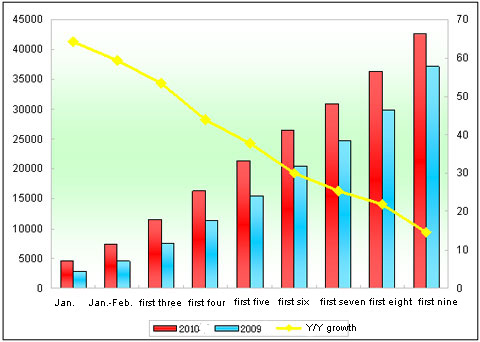
The monthly sales of city buses grows in the first three quarters with obvious decreasing increasing range
Table: Statistics of Growth Range of City Buses in the first three quarters 2010 and 2009
|
|
Jan.
|
Jan.-Feb.
|
First 3 Months
|
First 4 Months
|
First 5 Months
|
|
2010
|
4552
|
7357
|
11561
|
16381
|
21270
|
|
2009
|
2770
|
4612
|
7530
|
11372
|
15438
|
|
Year-on-year growth
|
64.3
|
59.5
|
53.5
|
44
|
37.8
|
|
|
First 6 Months
|
First 7 Months
|
First 8 Months
|
First 9 Months
|
|
|
2010
|
26544
|
30907
|
36391
|
42612
|
|
|
2009
|
20402
|
24667
|
29869
|
37199
|
|
|
Year-on-year growth
|
30.1
|
25.3
|
21.8
|
14.6
|
|

Chart: Statistics of Growth Range of City Buses in the first three quarters 2010 and 2009
Shown above,
Positive sales growth in each month for city buses
The growth range is decreasing month by month from 64.3% in Jan. to 14.6% in the first 9 months. Two major points lead to such result: (a). Overall good tend of national economic development including bus market; (b). Affected by financial crisis in 2009, the sales volume of city buses is small in 2009, while the sales increasingly grow which contributes to the big base.
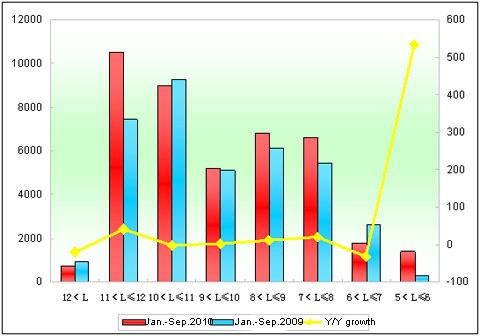
The Biggest Growth Range Shows at 5-6m city bus market; the biggest growth volumes shows at 11-12m and strong market demand on mainstream routes in middle and large cities.
Table: Sales Statistics of Buses at various lengths in the first Nine Months
|
|
12<L
|
11<L≤12
|
10<L≤11
|
9<L≤10
|
|
First 9 months 2010
|
750
|
10516
|
8999
|
5177
|
|
First 9 months 2009
|
930
|
7424
|
9278
|
5098
|
|
Year-on-year Growth
|
-19.4
|
41.6
|
-3
|
1.55
|
|
|
8<L≤9
|
7<L≤8
|
6<L≤7
|
5<L≤6
|
|
First 9 months 2010
|
6812
|
6610
|
1775
|
1417
|
|
First 9 months 2009
|
6131
|
5472
|
2606
|
260
|
|
Year-on-year Growth
|
11.1
|
20.8
|
-31.9
|
535
|

Chart: Sales Statistics of Buses at various lengths in the first Nine Months
Shown above,
The sales of city buses goes up 14.550% in the first nine months, positive growth at all lengths apart from 6-7m, 10-11m and extra large. In particular, the growth of 5-6m city buses exceeds 535%. The growth potential of rural city buses is big. The growth of 11-12m large buses reaches 41.6% (3092 units), amounting for about 25% of total growth. The demand of city buses in mainstream routes in middle and large cities is the strongest in the first three quarters.
