Summarize:www.chinabuses.org:
Analysis of Sales Growth of Bus Industry in Jan. - Sep. 2010 and Jan. - Sep. 2009
1. Sales Growth in Various Lengths
Table 1: Sales Growth Statistics Table in various lengths for buses in Jan.- Sep. 2010
|
|
Total
|
12<L
|
11<L≤12
|
10<L≤11
|
9<L≤10
|
|
Jan.-Sep. 2010
|
148401
|
1180
|
30198
|
17474
|
8816
|
|
Jan.-Sep. 2009
|
109266
|
1666
|
18481
|
14857
|
8754
|
|
Year-on-year Growth
|
35.82
|
-29.17
|
63.4
|
17.5
|
0.71
|
| |
8<L≤9
|
7<L≤8
|
6<L≤7
|
5<L≤6
|
3.5<L≤5
|
|
Jan.-Sep. 2010
|
19164
|
23343
|
20486
|
18067
|
9673
|
|
Jan.-Sep. 2009
|
14179
|
19007
|
19107
|
7321
|
5894
|
|
Year-on-year Growth
|
35.16
|
22.8
|
7.2
|
146.8
|
64.3
|
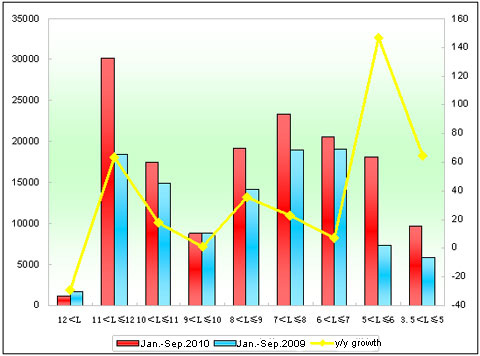
Chart 1: Sales Growth Statistics Table in various lengths for buses in Jan.-Sep.2010
Shown above,
The sales goes up 35.82% in Jan. - Sep., 2010 than Jan. - Sep., 2009. In lengths, the sales of buses in all lengths (extra large buses excluded) increase, which is the ninth successive growth after the first eight months in 2010. However, the growth rate slightly decreases compared with previous months. The biggest growth show at 5-6 meter and the smallest growth at 6-7 meter. Meanwhile, the development of 11-12 buses is strong. It indicates the ovbious development trend of rural passenger transport market.
2. Analysis of Sales Growth of King Long Bus in Various Lengths
Table 2: Sales Growth Statistics Table of King Long Bus in various lengths for buses in Jan. - Sep. 2010
|
|
Total
|
12<L
|
11<L≤12
|
10<L≤11
|
9<L≤10
|
|
Jan.-Sep. 2010
|
17017
|
48
|
3532
|
2137
|
512
|
|
Jan.-Sep. 2009
|
9846
|
40
|
2949
|
1253
|
485
|
|
Year-on-year Growth
|
72.8
|
20
|
19.7
|
70.6
|
5.57
|
|
Industry Growth
|
35.82
|
-29.17
|
63.4
|
17.5
|
0.71
|
| |
8<L≤9
|
7<L≤8
|
6<L≤7
|
5<L≤6
|
|
|
Jan.-Sep. 2010
|
2199
|
1212
|
492
|
6885
|
|
|
Jan.-Sep. 2009
|
1582
|
1175
|
0
|
2362
|
|
|
|
39
|
3.1
|
100
|
191.5
|
|
|
Industry Growth
|
35.16
|
22.8
|
7.2
|
146.8
|
|
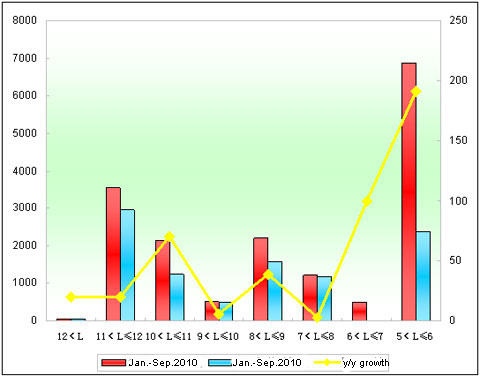
Chart 2: Sales Growth Statistics Table of King Long Bus in various lengths for buses in Jan. - Sep. 2010
Shown above,
① The sales increase 7171 units (growth rate:72.8%) in Jan.-Sep.2010 than Jan.-Sep.2009, almost higher 37 percentage than the growth speed of the industry.
② It shows sales growth at all lengths,especially at 5-6 mete.The growth range of 10-11 meter buses is bigger than that of the industry.
③ The growth speed of King Long Bus is the highest during Yutong,King Long, Higer and Golden Dragon, in particular, small buses. The growth range of 11-12 meter buses is not good.
④The sales volume of extra large King Long buses is 48 units, 8 more ones than last year while negative growth in the industry.
Analysis of Sales Growth of Seat Buses in Jan.-Sep.2010 and Jan. - Sep.2009
1. Sales Growth of Seat Buses in the Bus Industry
Table 3: Sales Growth Statistics Table of Seats Buses in various lengths for buses in Jan. - Sep.2010
| |
Total
|
12<L
|
11<L≤12
|
10<L≤11
|
9<L≤10
|
|
Jan.-Sep. 2010
|
102857
|
290
|
17412
|
8459
|
3573
|
|
Jan.-Sep. 2009
|
69991
|
496
|
9402
|
5566
|
3652
|
|
|
46.95
|
-41.5
|
85.2
|
52
|
-2.16
|
| |
8<L≤9
|
7<L≤8
|
6<L≤7
|
5<L≤6
|
3.5<L≤5
|
|
Jan.-Sep. 2010
|
12339
|
16705
|
18510
|
16455
|
9114
|
|
Jan.-Sep. 2009
|
8015
|
13533
|
16372
|
7061
|
5894
|
|
|
53.9
|
23.4
|
13.1
|
133
|
54.6
|
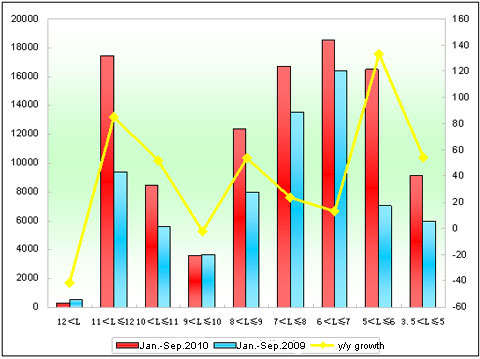
Chart 3: Sales Growth Statistics Table of Seats Buses in various lengths for buses in Jan. - Sep.2010
Shown above,
The sales goes up 46.95% for seat buses in Jan.-Sep.2010, and growth rate is higher than that of the overall bus market. In lengths, it only reduces in extra large and 9-10 meter buses, while all increase in other lengths. It indicates that the sales increasing of seat buses is the main factor for the growth of the general bus market in the first nine months in 2010 and the partial decreasing of extra large and 9-10 meter buses.
 editor@chinabuses.org
 86-10-84933192;


