Summarize:www.chinabuses.org:
2. King Long Seat Buses
Table 4: Sales Growth Statistics Table of King Long Seat Buses in various lengths for buses in Jan.-Sep. 2010
|
|
Total
|
12<L
|
11<L≤12
|
10<L≤11
|
9<L≤10
|
|
Jan.-Sep.2010
|
14289
|
1
|
2756
|
1389
|
305
|
|
Jan.-Sep.2009
|
7551
|
40
|
1616
|
703
|
485
|
|
|
89.23
|
-97.5
|
70.5
|
97.6
|
-37.1
|
|
Industry growth
|
46.95
|
-41.5
|
85.2
|
52
|
-2.16
|
| |
8<L≤9
|
7<L≤8
|
6<L≤7
|
5<L≤6
|
|
|
Jan.-Sep.2010
|
1600
|
861
|
492
|
6885
|
|
|
Jan.-Sep.2009
|
1170
|
1175
|
0
|
2362
|
|
|
|
36.8
|
-26.7
|
100
|
191.5
|
|
|
Industry growth
|
53.9
|
23.4
|
13.1
|
133
|
|

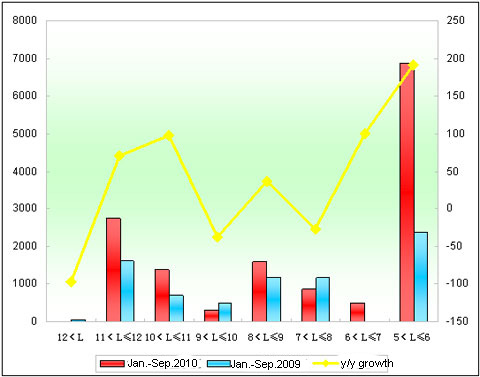
Chart 4: Sales Growth Statistics Chart of King Long Seat Buses in various lengths for buses in Jan.-Sep. 2010
Shown above,
① The sales of King Long Bus seat buses increases 89.23%, almost 43 percentage higher than the growth rate of the industry and about 17 percentage higher than that of its general growth in Jan.-Sep.2010. It indicates that the growth of King Long seat buses speeds up in the first nine months of 2010 and the growth of seat buses is the main factor for that of King Long Bus.
② The sales growth of King Long seat buses are positive at all lenths apart from extra large and 7-8 meter buses,in particular, 5-6 meter buses(191.5% growth,4523 units more). It indicates that the growth of 5-6 meter buses contribute to the overall increasing of King Long seat buses.
In addition, the sales volume of extra large buses is only one unit in Jan.-Sep.2010 while 40 units in Jan.-Sep.2009. Such is not good for the profit development of King Long Bus.
Analysis of Sales Growth of City Buses in Various Lengths in Jan.-Analysis of Sales Growth of City Buses in Various Lengths in Jan.-Aug.2010 and Jan.-Sep.2009
1. The Sales Growth of City Buses in Various Lengths for the Bus Industry
Table 5: Sales Growth Statistics Table of City Buses in various lengths for buses in Jan.-Sep.2010 and Jan.-Sep.2009
1. The Sales Growth of City Buses in Various Lengths for the Bus Industry
Table 5: Sales Growth Statistics Table of City Buses in various lengths for buses in Jan.- Sep.2010
| |
Total
|
12<L
|
11<L≤12
|
10<L≤11
|
9<L≤10
|
|
Jan.-Sep.2010
|
42612
|
750
|
10516
|
8999
|
5177
|
|
Jan.-Sep.2009
|
37199
|
930
|
7424
|
9278
|
5098
|
|
Year-on-year growth
|
14.55
|
-19.4
|
41.6
|
-3
|
1.55
|
| |
8<L≤9
|
7<L≤8
|
6<L≤7
|
5<L≤6
|
|
|
Jan.-Sep.2010
|
6812
|
6610
|
1775
|
1417
|
|
|
Jan.-Sep.2009
|
6131
|
5472
|
2606
|
260
|
|
|
Year-on-year growth
|
11.1
|
20.8
|
-31.9
|
535
|
|

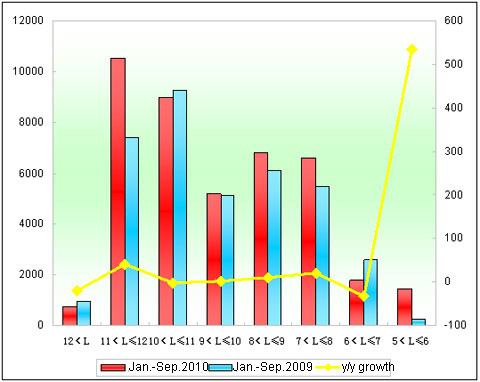
Chart 5: Sales Growth Statistics Chart of City Buses in various lengths for buses in Jan.–Sep.2010
Shown above,
The sales of city buses increases 14.55% in Jan.-Sep.2010. The growth range is smaller than both that of seat buses and the overall growth of the bus market. In lengths, the sales of buses at all lengths show positive growth, apart from 6-7 meter,10-11 meter and extra large buses,in particular, 5-6 meter buses (535% growth), which indicate the great potential of rural city bus market and then 11-2 city buses, which indicates the big market demand in mainstream courses in big and middle cities.
2. King Long City Buses
Table 6: Sales Growth Statistics Table of King Long City Buses in various lengths for buses in Jan.-Sep. 2010
| |
Total
|
12<L
|
11<L≤12
|
10<L≤11
|
|
Jan.-Sep.2010
|
2588
|
44
|
639
|
748
|
|
Jan.-Sep.2009
|
2198
|
0
|
1238
|
550
|
|
|
17.7
|
100
|
-48.4
|
36
|
|
Industry growth
|
14.55
|
-19.4
|
41.6
|
-3
|
| |
9<L≤10
|
8<L≤9
|
7<L≤8
|
|
|
Jan.-Sep.2010
|
207
|
599
|
351
|
|
|
Jan.-Sep.2009
|
0
|
410
|
0
|
|
|
|
100
|
46.1
|
100
|
|
|
ndustry growth
|
1.55
|
11.1
|
20.8
|
|

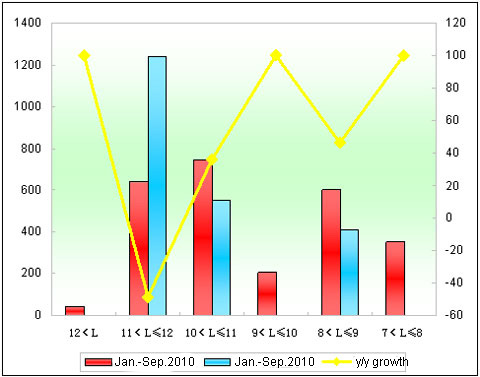
Chart 6: Sales Growth Statistics Chart of King Long City Buses in various lengths for buses in Jan.-Sep. 2010
Shown above,
① The sales volume of King Long city buses grows 17.7% in the first nine months while 14.55% in the industry in the same period of time. It indicates that the growth of seat buses rather than city buses leads to the increasing of King Long Bus.
② The sales of King Long 10-11 city buses increases 36% while -3% in the industry;46.1% for 8-9 city buses while 11.1% in the industry; 44 more units for extra large buses while decreasing in the industry.
Moreover, the sales of 11-12 King Long city buses drops to big degree while it grows greatly in the bus industry.
