Summarize:www.chinabuses.org:
2. Higer Seat Buses
Table 4: Sales Growth Statistics Table of Higer Seat Buses in various lengths for buses in Jan.-Oct. 2010
|
|
Total
|
12<L
|
11<L≤12
|
10<L≤11
|
9<L≤10
|
|
Jan.-Oct.2010
|
11822
|
53
|
2750
|
1454
|
215
|
|
Jan.-Oct.2009
|
8730
|
46
|
1174
|
502
|
1181
|
|
|
35.4
|
15.2
|
134.2
|
189.6
|
-81.8
|
|
Industry growth
|
46.5
|
-45.5
|
82.8
|
46.8
|
-3.4
|
| |
8<L≤9
|
7<L≤8
|
6<L≤7
|
5<L≤6
|
|
|
Jan.-Oct.2010
|
2211
|
2759
|
477
|
1903
|
|
|
Jan.-Oct.2009
|
1390
|
2617
|
1820
|
0
|
|
|
|
59.1
|
5.4
|
-73.8
|
100
|
|
|
Industry growth
|
49.6
|
21.5
|
13.3
|
135.4
|
|

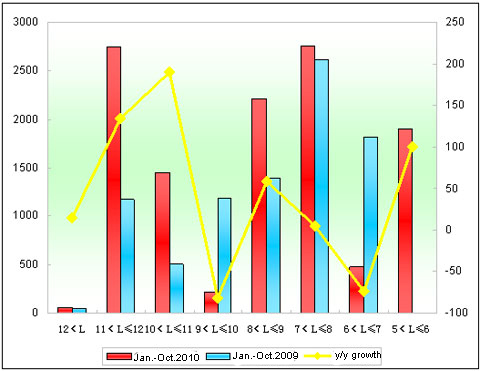
Chart 4: Sales Growth Statistics Chart of Higer Seat Buses in various lengths for buses in Jan.-Sep. 2010
Shown above,
① The sales of Higer Bus seat buses increases 35.4%, almost 8 percentage higher than the growth rate of the general bus market in Jan.-Oct.2010. It indicates that the growth of Higer seat buses decreases in the first ten months of 2010 and the growth of seat buses is not the main factor for that of Higer Bus.
②The growth of Higer 11-12 meter seat buses reaches 134.2% in Jan.-Oct.2010 while 82.8% in the industry; 9-10 meter reaches -81.8% while -3.4% in the industry. It indicates that Higer Bus is making progress in large seat buses industry and the traditional advantage of Higer is decreasing for 9-10 meter buses.
③The sales growth of Higer seat buses are higher than that in the industry at extra large, 11-12 meter, 10-11 meter and 8-9 meter buses, in particular, extra large buses (15.2%). It indicates the obvious development of Higer large seat buses.
Analysis of Sales Growth of City Buses in Various Lengths in Jan.-Analysis of Sales Growth of City Buses in Various Lengths in Jan.-Oct.2010 and Jan.-Oct.2009
1. The Sales Growth of City Buses in Various Lengths for the Bus Industry
Table 5: Sales Growth Statistics Table of City Buses in various lengths for buses in Jan.-Oct.2010 and Jan.-Oct.2009
|
|
Total
|
12<L
|
11<L≤12
|
10<L≤11
|
9<L≤10
|
|
Jan.-Oct.2010
|
47803
|
789
|
11596
|
10376
|
5801
|
|
Jan.-Oct.2009
|
41410
|
990
|
8610
|
9959
|
6023
|
|
Year-on-year growth
|
15.4
|
-20.3
|
34.7
|
4.2
|
-3.7
|
| |
8<L≤9
|
7<L≤8
|
6<L≤7
|
5<L≤6
|
|
|
Jan.-Oct.2010
|
7672
|
7404
|
1941
|
1558
|
|
|
Jan.-Oct.2009
|
6788
|
5967
|
2795
|
278
|
|
|
Year-on-year growth
|
13
|
24.1
|
-30.6
|
460.4
|
|

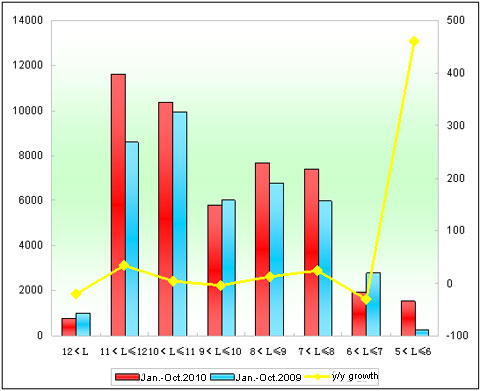
Chart 5: Sales Growth Statistics Chart of City Buses in various lengths for buses in Jan.–Oct.2010
Shown above,
The sales of city buses increases 15.4% in Jan.-Oct.2010. In lengths, the sales of buses at all lengths show positive growth, apart from 6-7 meter,9-10 meter and extra large buses,in particular, 5-6 meter buses (460.4% growth), which indicate the great potential of rural city bus market and then 11-2 city buses, which indicates the big market demand in mainstream courses in big and middle cities.
2.Higer City Buses
Table 6: Sales Growth Statistics Table of Higer City Buses in various lengths for buses in Jan.-Oct. 2010
| |
Total
|
12<L
|
11<L≤12
|
10<L≤11
|
|
Jan.-Oct.2010
|
4510
|
8
|
878
|
1382
|
|
Jan.-Oct.2009
|
2920
|
16
|
293
|
212
|
|
|
54.5
|
-50
|
199.7
|
551.9
|
|
Industry growth
|
15.4
|
-20.3
|
34.7
|
4.2
|
| |
9<L≤10
|
8<L≤9
|
7<L≤8
|
|
|
Jan.-Oct.2010
|
673
|
1076
|
493
|
|
|
Jan.-Oct.2009
|
1583
|
532
|
284
|
|
|
|
-57.5
|
102.3
|
73.6
|
|
|
Industry growth
|
3.7
|
13
|
24.1
|
|

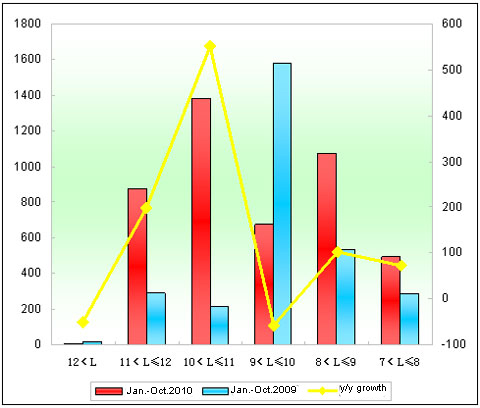
Chart 6: Sales Growth Statistics Chart of Higer City Buses in various lengths for buses in Jan.-Oct. 2010
Shown above,
① The sales volume of Higer city buses is 4510 units (15.4% growth) in the first ten months in 2010, 1590 units more than in the same period of time in 2009.
② The sales of Higer city buses increases 585 units for 11-12 meter, 1170 units for 10-11 meter, 544 units for 8-9 meter and 209 units for 7-8 meter.
③ The growth of Higer city buses is much bigger than that of the industry, also bigger than its overall growth. It indicates that the increasing of city buses mainly leads to the growth of Higer buses.
