Summarize:www.chinabuses.org: Part 1 Sales growth analysis of China bus industry from Jan. to Oct. 2010 over last year
1. Sales growth of buses in all lengths
Table 1 Statistics of sales growth of buses in all lengths from Jan to Oct. 2010
|
|
Total
|
12<L
|
11<L≤12
|
10<L≤11
|
9<L≤10
|
|
Jan– Oct. 2010
|
164694
|
1254
|
33108
|
19664
|
9713
|
|
Jan– Oct. 2009
|
121332
|
1863
|
20827
|
16287
|
10009
|
|
Growth
|
35.7
|
-32.7
|
59
|
20.7
|
-2.95
|
| |
8<L≤9
|
7<L≤8
|
6<L≤7
|
5<L≤6
|
3.5<L≤5
|
|
Jan– Oct. 2010
|
21054
|
25781
|
22583
|
20451
|
11086
|
|
Jan– Oct. 2009
|
15757
|
21072
|
20950
|
8216
|
6351
|
|
|
33.6
|
22.3
|
7.8
|
148.9
|
74.6
|
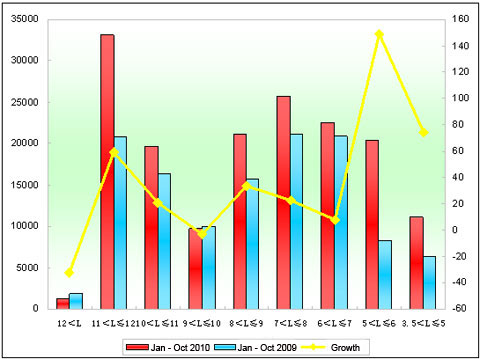
Figure 1 Statistics of sales growth of buses in all lengths from Jan. to Oct. 2010
It can be seen from above that:
Sales of the first ten months were up 35.7% than last year. Sales of all buses, expect buses over 12m, increased, which is the tenth month growth this year. We can see that the general good China economy is promoting sales of buses. The largest growth were 5-6m buses, and then it comes 3.5-5m and 11-12m. Bus needs in countryside markets are growing steadily.
2. Sales growth of Yutong buses in all lengths
Table 2 Statistics of sales growth of Yutong buses in all lengths from Jan to Oct.
|
|
Total
|
12<L
|
11<L≤12
|
10<L≤11
|
|
Jan– Oct. 2010
|
31066
|
228
|
9245
|
3543
|
|
Jan– Oct. 2009
|
20411
|
236
|
5047
|
2606
|
|
Growth
|
52.2
|
-3.4
|
83.2
|
5.96
|
|
Growth in industry
|
35.7
|
-32.7
|
59
|
20.7
|
| |
9<L≤10
|
8<L≤9
|
7<L≤8
|
6<L≤7
|
|
Jan– Oct. 2010
|
2199
|
6181
|
6585
|
3085
|
|
Jan– Oct. 2009
|
1354
|
3358
|
5184
|
2626
|
|
|
62.4
|
84.1
|
27
|
17.5
|
|
Growth in industry
|
-2.95
|
33.6
|
22.3
|
7.8
|
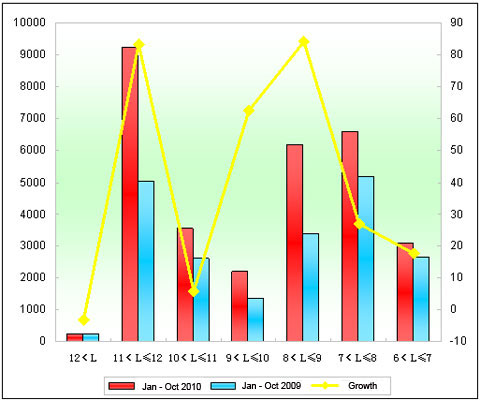
Figure 2 Statistics of sales growth of Yutong buses in all lengths from Jan to Oct. 2010
It can be seen from above that:
1. Sales of Yutong buses in the first ten months increased by 52.2%, nearly 15% higher than the growth in bus industry, showing that the leading bus maker is increasing strongly.
2. Sales of Yutong buses in all lengths increased. 8-9m buses saw the biggest growth by 84.1%%, and sales of 11-12m buses increased by 83.2%, 24.2% bigger than the growth in bus industry. This is also Yutong traditional advantageous markets.
3. Sales of Yutong super large buses increased by -3.4%, and sales in the bus industry has decreased by 32.7%. Sales of 9-10m, 10-11m, 6-7m, and 7-8m buses were also increasing.
4. 9,245 11-12m Yutong buses were sold, so Yutong Bus is still the leader among Yutong, Kinglong, Higer, and Golden Dragon.
Part 2 Sales analysis of coaches of all lengths from Jan to Oct. 2010 over 2009
1. Sales growth of coaches in all lengths
Table 3 Sales growth statistics of coaches in all lengths Jan. to Oct. 2010
|
|
Total
|
12<L
|
11<L≤12
|
10<L≤11
|
9<L≤10
|
|
Jan– Oct. 2010
|
113670
|
313
|
19006
|
9272
|
3846
|
|
Jan– Oct. 2009
|
77607
|
574
|
10395
|
6314
|
3982
|
|
Growth
|
46.5
|
-45.5
|
82.8
|
46.8
|
-3.4
|
| |
8<L≤9
|
7<L≤8
|
6<L≤7
|
5<L≤6
|
3.5<L≤5
|
|
Jan– Oct. 2010
|
13369
|
18344
|
20420
|
18683
|
10417
|
|
Jan– Oct. 2009
|
8936
|
15103
|
18014
|
7938
|
6351
|
|
Growth
|
49.6
|
21.5
|
13.3
|
135.4
|
64
|
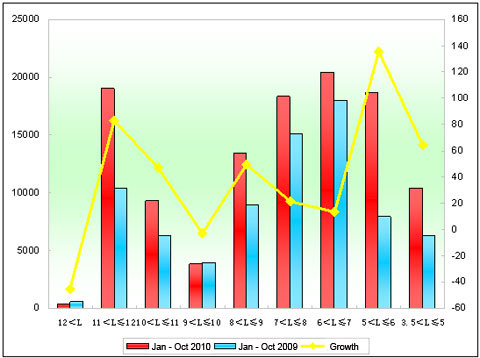
Figure3 Statistics of sales growth of coaches in all lengths Jan. to Oct. 2010
It can be seen from above that:
Sales of coaches increased 46.5% in the first ten months, nearly 10% less than the growth in bus industry. In terms of lengths, sales of all buses, except super large buses and 9-10m buses, were increasing. We can see that sales of super large buses were still decreasing. 5-6m buses saw the biggest growth, and then it comes 11-12m, 3.5-5m, and 6-7m, showing that sales growth of coaches were the main driving force for the general growth of buses in the first ten months. And the main reason contributes the China macro economy.
2. Zhengzhou Yutong coaches
Table 4 Statistics of Yutong coaches sales growth in all lengths Jan to Oct. 2010
|
|
Total
|
12<L
|
11<L≤12
|
10<L≤11
|
|
Jan– Oct. 2010
|
22520
|
100
|
5517
|
2435
|
|
Jan– Oct. 2009
|
15304
|
83
|
2858
|
1910
|
|
Growth
|
46.8
|
20.5
|
93
|
27.5
|
|
Growth in bus industry
|
46.5
|
-45.5
|
82.8
|
46.8
|
| |
9<L≤10
|
8<L≤9
|
7<L≤8
|
6<L≤7
|
|
Jan– Oct. 2010
|
1534
|
4487
|
5362
|
3085
|
|
Jan– Oct. 2009
|
831
|
2563
|
4433
|
2626
|
|
Growth
|
84.6
|
75.1
|
21
|
17.5
|
|
Growth in bus industry
|
-3.4
|
49.6
|
21.5
|
13.3
|
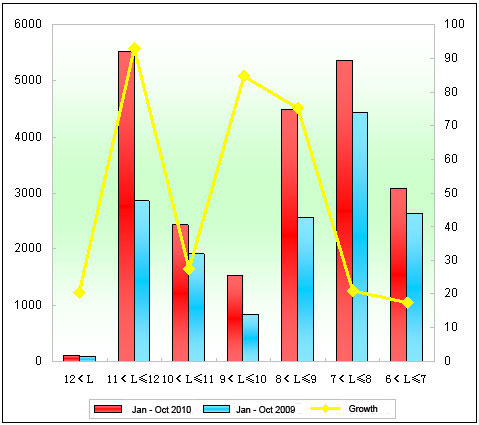
Figure 4 Statistics of Yutong coaches sales growth in all lengths Jan. to Oct. 2010
It can be seen from above that:
1. Sales of Yutong coaches increased by 46.5%, similar to the growth of the bus industry, and the sales growth in the first ten months were 52.2%, showing that sales growth of coaches were not the main force for the general growth in the first three quarters.
2. Sales of all lengths of coaches were increasing, in which, sales of super large coaches increased by 20.5%, while sales in bus industry were decreasing; sales of 11-12m coaches increased by 93%. Sales of Yutong buses were higher than the bus industry except 10-11m and 7-8m.
Part 3 Sales growth of city buses in all lengths in the first ten months in 2010 over 2009
1. Sales growth of city buses in all lengths
Table 5 Statistics of sales growth of city buses in all lengths
|
|
Total
|
12<L
|
11<L≤12
|
10<L≤11
|
9<L≤10
|
|
Jan– Oct. 2010
|
47803
|
789
|
11596
|
10376
|
5801
|
|
Jan– Oct. 2009
|
41410
|
990
|
8610
|
9959
|
6023
|
|
Growth
|
15.4
|
-20.3
|
34.7
|
4.2
|
-3.7
|
| |
8<L≤9
|
7<L≤8
|
6<L≤7
|
5<L≤6
|
|
|
Jan– Oct. 2010
|
7672
|
7404
|
1941
|
1558
|
|
|
Jan– Oct. 2009
|
6788
|
5967
|
2795
|
278
|
|
|
Growth
|
13
|
24.1
|
-30.6
|
460.4
|
|
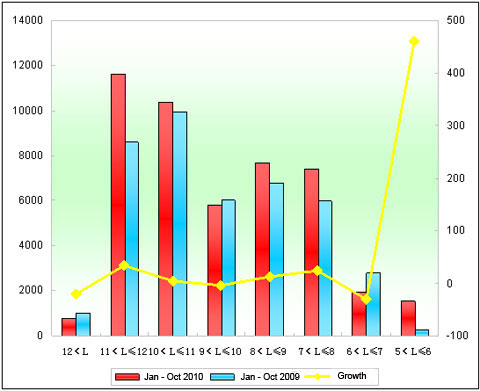
Figure 5 Statistics of sales growth of city buses in all lengths
It can be seen from above that:
Sales of Yutong city buses increased by 15.4%, and this is the tenth growth this year, showing that sales of city buses were much driven by national policies, and the sales growth is also the main reason for sales growth, and sales of city buses were smaller than average growth, so it is not the main reason for the growth of the bus markets. In terms of lengths, sales of super large buses, 9-10m buses and 6-7m buses decreased, sales of other lengths buses increased. Sales of 5-6m buses were increased by 460.4%, showing that countryside markets are soaring. And sales of 11-12m increased, but not that much compared with September.
2. Zhengzhou Yutong city buses
Table 6 Statistics of Yutong city buses sales growth in all lengths in the first ten months
|
|
Total
|
12<L
|
11<L≤12
|
10<L≤11
|
|
Jan– Oct. 2010
|
7068
|
71
|
2307
|
1108
|
|
Jan– Oct. 2009
|
4042
|
99
|
1178
|
696
|
|
Growth
|
74.9
|
-28.3
|
95.8
|
59.2
|
|
Growth in bus industry
|
15.4
|
-20.3
|
34.7
|
4.2
|
| |
9<L≤10
|
8<L≤9
|
7<L≤8
|
|
|
Jan– Oct. 2010
|
665
|
1694
|
1223
|
|
|
Jan– Oct. 2009
|
523
|
795
|
751
|
|
|
Growth
|
27.1
|
113.1
|
62.85
|
|
|
Growth in bus industry
|
-3.7
|
13
|
24.1
|
|
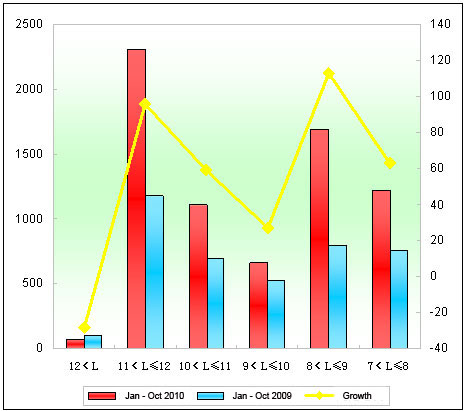
Figure 6 Statistics of Yutong city buses sales growth in all lengths in the first ten months
It can be seen from above that:
1. Sales of Yutong city buses increased by 74.9%, much higher than the growth of 15.4% in China bus industry. Sales growth of Yutong city buses in the first ten months were 51% higher than bus industry. We can that sales of Yutong city buses are increasing much faster than coaches and the main bus products. Yutong bus become the actual number one in China city bus market.
2. 1,129 more Yutong 11-12m city buses were sold out, up 95.8%, nearly 61% higher than the growth in bus industry. While sales of super large buses decreased by 28 units, down 28.3%, higher than the sales decrease in bus industry.
3. Sales of 9-10m city buses increased by 27.1%, and the sales of such buses in bus industry were decreasing. And sales of 8-9m city buses saw the biggest growth.
