Summarize:www.chinabuses.org: Part 1 Sales growth analysis of China bus industry from Jan. to Nov. 2010 over last year
1. Sales growth of buses in all lengths
Table 1 Statistics of sales growth of buses in all lengths from Jan to Nov. 2010
|
|
Total
|
12<L
|
11<L≤12
|
10<L≤11
|
9<L≤10
|
|
Jan.-Nov.
2010
|
186215
|
1390
|
36808
|
22756
|
11064
|
|
Jan.-Nov.
2009
|
140332
|
2085
|
23765
|
18249
|
11081
|
|
Growth
|
32.7
|
-33.3
|
54.9
|
24.7
|
-0.15
|
| |
8<L≤9
|
7<L≤8
|
6<L≤7
|
5<L≤6
|
3.5<L≤5
|
|
Jan.-Nov.
2010
|
23052
|
29364
|
25591
|
22913
|
13277
|
|
Jan.-Nov.
2009
|
17730
|
24626
|
26369
|
9307
|
7120
|
|
|
30
|
19.2
|
-2.95
|
146.2
|
86.5
|

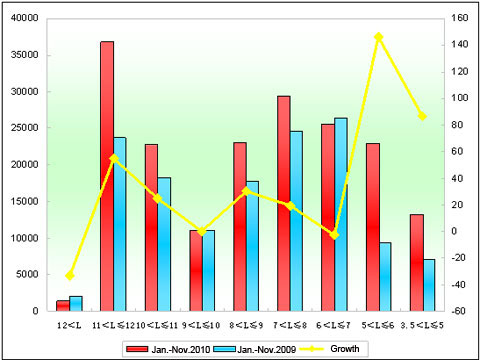
Figure 1 Statistics of sales growth of buses in all lengths from Jan. to Nov. 2010
It can be seen from above that:
Sales of the first eleven months were up 32.7% than last year. We can see that the general good China economy is promoting sales of buses, but it affects different lengths buses. The largest growths were 5-6m buses, and then it comes 3.5-5m and 11-12m. Bus needs in countryside markets are growing steadily. Sales of super large buses, 9-10m buses, 6-7m buses were decreasing.
2. Sales growth of Yutong buses in all lengths
Table 2 Statistics of sales growth of Yutong buses in all lengths from Jan to Nov.
|
|
Total
|
12<L
|
11<L≤12
|
10<L≤11
|
|
Jan.-Nov.
2010
|
35543
|
259
|
10491
|
4248
|
|
Jan.-Nov.
2009
|
23287
|
252
|
5870
|
2910
|
|
|
52.6
|
2.7
|
78.7
|
46
|
|
Growth in bus industry
|
32.7
|
-33.3
|
54.9
|
24.7
|
| |
9<L≤10
|
8<L≤9
|
7<L≤8
|
6<L≤7
|
|
Jan.-Nov.
2010
|
2843
|
6895
|
7376
|
3431
|
|
Jan.-Nov.
2009
|
1511
|
3914
|
5865
|
2965
|
|
|
88.2
|
76.2
|
25.9
|
15.7
|
|
Growth in bus industry
|
-0.15
|
30
|
19.2
|
-2.95
|

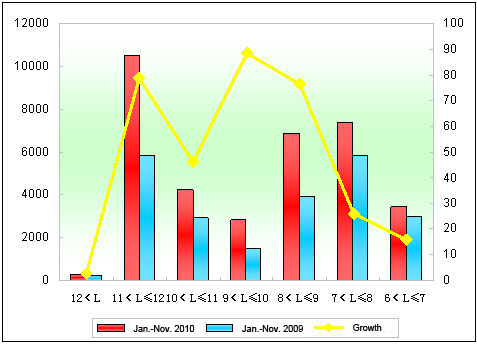
Figure 2 Statistics of sales growth of Yutong buses in all lengths from Jan to Nov. 2010
It can be seen from above that:
1. Sales of Yutong buses in the first eleven months increased by 52.6%, nearly 15% higher than the growth in bus industry, showing that the leading bus maker is increasing strongly.
2. Sales of Yutong buses in all lengths increased, which were all exceeding the growth of bus industry. 11-12m and 8-9m buses saw the biggest growth by 78.7% and 76.2%, and sales of 11-12m buses were nearly 24% bigger than the growth in bus industry. This is also Yutong traditional advantageous markets.
3. Sales of Yutong super large buses increased by 2.7%, and sales in the bus industry has decreased by 33.3%. Sales of 9-10m, 10-11m, 6-7m, and 7-8m buses were also increasing.
4. 10,491 11-12m Yutong buses were sold, 5,071 units more than the buses sold in the first ten months, so Yutong Bus is still the leader among Yutong, Kinglong, Higer, and Golden Dragon.
Part 2 Sales analysis of coaches of all lengths from Jan to Nov. 2010 over 2009
1. Sales growth of coaches in all lengths
Table 3 Sales growth statistics of coaches in all lengths Jan. to Nov. 2010
|
|
Total
|
12<L
|
11<L≤12
|
10<L≤11
|
9<L≤10
|
|
Jan.-Nov.
2010
|
128247
|
344
|
20995
|
10275
|
4549
|
|
Jan.-Nov.
2009
|
91013
|
678
|
11834
|
7183
|
4487
|
|
Growth
|
40.9
|
-49.3
|
77.4
|
43
|
1.4
|
| |
8<L≤9
|
7<L≤8
|
6<L≤7
|
5<L≤6
|
3.5<L≤5
|
|
Jan.-Nov.
2010
|
14743
|
20625
|
23229
|
20966
|
12521
|
|
Jan.-Nov.
2009
|
10050
|
17695
|
22963
|
9003
|
7120
|
|
|
46.7
|
16.6
|
1.2
|
132.9
|
75.9
|

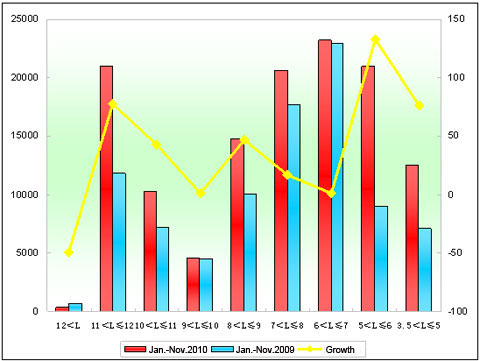
Figure3 Statistics of sales growth of coaches in all lengths Jan. to Nov. 2010
It can be seen from above that:
Sales of coaches increased 40.9% in the first eleven months, nearly 8% more than the growth in bus industry. In terms of lengths, sales of all buses, except super large buses, were increasing. We can see that sales of super large buses were still decreasing. 5-6m buses saw the biggest growth, and then it comes 11-12m, 3.5-5m, showing that sales growth of coaches were the main driving force for the general growth of buses in the first ten months. And the main reason contributes the China macro economy.
2. Zhengzhou Yutong coaches
Table 4 Statistics of Yutong coaches sales growth in all lengths Jan to Nov. 2010
|
|
Total
|
12<L
|
11<L≤12
|
10<L≤11
|
|
Jan.-Nov.
2010
|
25410
|
116
|
6218
|
2711
|
|
Jan.-Nov.
2009
|
17546
|
93
|
3493
|
2091
|
|
Growth
|
44.8
|
24.7
|
78
|
29.7
|
|
Growth in bus industry
|
40.9
|
-49.3
|
77.4
|
43
|
| |
9<L≤10
|
8<L≤9
|
7<L≤8
|
6<L≤7
|
|
Jan.-Nov.
2010
|
2001
|
4967
|
5966
|
3431
|
|
Jan.-Nov.
2009
|
934
|
2927
|
5043
|
2965
|
|
|
114.2
|
69.7
|
18.3
|
15.7
|
|
Growth in bus industry
|
1.4
|
46.7
|
16.6
|
1.2
|

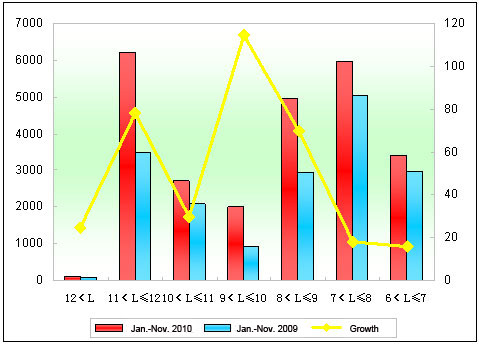
Figure 4 Statistics of Yutong coaches sales growth in all lengths Jan. to Nov. 2010
It can be seen from above that:
1. Sales of Yutong coaches increased by 44.8%, nearly 4% higher the growth of the bus industry, and the sales growth in the first eleven months were 52.6%, showing that sales growth of coaches were not the main force for the general growth in the first three quarters.
2. Sales of all lengths of coaches were increasing, in which, sales of super large coaches increased by 24.7%, while sales in bus industry were decreasing; sales of 11-12m coaches increased by 78%. Sales of Yutong buses were higher than the bus industry except 10-11m buses.
