Summarize: www.chinabuses.org:
The Brief Analysis of the Sales of New Energy Buses in Jan.-Nov.2010
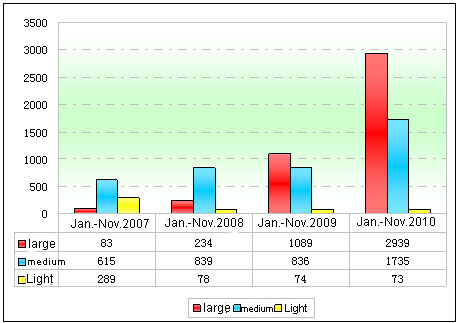
According to the statistic data, the production and the sales volume of new energy buses is 4911 units and 4771 units in 2009. Based on the market research, the annual sales of large and medium new energy buses take about 80%-90% of the total new energy buses. In particular, the sales of light and medium new energy buses are decreasing while large buses increasing in Jan.-Nov.2007 to Jan.-Nov. 2010.
In Jan.-Nov.2010, it sells 4747 new energy buses, accounting for over 97% of the new energy commercial vehicles. The big sales of the buses are mainly shown in April and May, over 600 units each month. Large and medium buses are main models for new energy buses in business operation due to frequent starting/stopping of city buses. The purchasers are mainly the government departments or enterprises. It is no doubt that the development of the new energy vehicles presents the future direction and new energy buses are the focus points for the production and the competition of our vehicles producers.
Table: Statistics table of Sales of New Energy Buses in Jan.-Nov. 2007 to Jan.-Nov.2010
|
Jan.-Nov
|
2007
|
2008
|
2009
|
2010
|
|
Large
|
83
|
234
|
1089
|
2939
|
|
Medium
|
615
|
839
|
836
|
1735
|
|
Light
|
289
|
78
|
74
|
73
|
|
Total
|
987
|
1151
|
1999
|
4747
|
Chart: Statistics chart of Sales of New Energy Buses in Jan.-Nov. 2007 to Jan.-Nov.2010

The feature of the sales of new energy buses is shown above:
1.Big sales growth up to 137.5% while only almost 30% for the general bus market in Jan.-Nov.2010
2.The fastest growth is shown at large new energy buses.
3.Large buses take the biggest market proportion, and then medium buses and light buses.
Analysis:
Firstly, national policy support and market demand development from 987 units in Jan.-Nov. 2007 to 4747 units in Jan.-Nov.2010.
Secondly, the subsidy standard for purchasing new energy buses is set in last year: the base price difference from conventional vehicles with the same type, scale effect and technology advancement are considered.
Subsidy Standard for 10-meter above City Buses (Unit: thousand Yuan/unit)
|
Type
|
fuel saving ratio
|
hybrid power(lead acid cell)
|
hybrid power (NI-MH battery;lithium ion battery;super capacito)
|
|
max. power ratio: 20%-50%
|
max. power ratio 50% above
|
|
Hybrid power
|
10%-20%
|
50
|
200
|
―
|
|
20%-30%
|
7
|
250
|
300
|
|
30%-40%
|
8
|
300
|
360
|
|
40% above
|
―
|
350
|
420
|
|
Electric
|
100%
|
―
|
―
|
500
|
|
Cell Power
|
100%
|
―
|
―
|
600
|
Large new energy buses are more suitable to the national subsidy policies in the respects of base price difference and technology content, compared with medium and light ones. In Jan.-Nov.2010, the sales of the large new energy buses are much better than that of others.
Thirdly, the profit of the large ones is bigger than others.
Fourthly, new energy buses are mainly operated in medium or large cities. 11-12 meter city bus market owns the biggest growth and sales.
Sales and Market Shares of New Energy Buses in 15 Key Region Markets in Jan.-Nov.2010
Table: Sales and Market Shares of New Energy Buses in 15 Key Region Markets in Jan.-Nov.2010
|
|
Region
|
Sales
|
Market Share
|
Note
|
|
1
|
Shanghai
|
591
|
12.45
|
electric, hybrid power, natural gas included
|
|
2
|
Guangdong
|
482
|
10.15
|
electric, hybrid power, natural gas included
|
|
3
|
Beijing
|
449
|
9.46
|
electric, hybrid power, natural gas included
|
|
4
|
Jiangsu
|
433
|
9.12
|
electric, hybrid power, natural gas included
|
|
5
|
Shandong
|
322
|
6.78
|
electric, hybrid power, natural gas included
|
|
6
|
Liaoning
|
249
|
5.25
|
electric, hybrid power, natural gas included
|
|
7
|
Anhui
|
203
|
4.28
|
electric, hybrid power, natural gas included
|
|
8
|
Hebei
|
196
|
4.13
|
electric, hybrid power, natural gas included
|
|
9
|
Sichuan
|
189
|
3.98
|
electric, hybrid power, natural gas included
|
|
10
|
Zhejiang
|
159
|
3.35
|
electric, hybrid power, natural gas included
|
|
11
|
Henan
|
131
|
2.76
|
electric, hybrid power, natural gas included
|
|
12
|
Hubei
|
121
|
2.55
|
electric, hybrid power, natural gas included
|
|
13
|
Hunan
|
108
|
2.28
|
electric, hybrid power, natural gas included
|
|
14
|
Jilin
|
104
|
2.17
|
electric, hybrid power, natural gas included
|
|
15
|
Yunnan
|
99
|
2.19
|
electric, hybrid power, natural gas included
|
|
|
Total
|
3836
|
80.9
|
electric, hybrid power, natural gas included
|
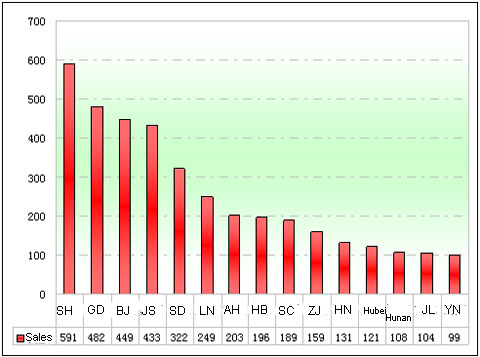
Chart: Sales and Market Shares of New Energy Buses in 15 Key Region Markets in Jan.-Nov.2010

Shown above,
1.The biggest market share is shown in Shanghai due to the World Expo in 2010.
2.The top six sales regions for new energy buses such as Shanghai, Guangdong, Jiangsu, Shandong and Liaoning are all comparatively developed ones and also the cities where the strategic development of new energy buses is implemented.
3.Compared with the conventional buses, the overall sales base of new energy buses is low, however, the development trend is strong.
4.Sichuan and Yunnan rank in the top 15 for new energy buses sales because of rich resources of natural gas.
5.The new energy buses take about 80.9% of market shares in top 15 mainstream sales regions in China and the other shares are taken by the rest of 17 regions.
Conclusion:
Highly concentrated sales regions for new energy buses, unbalanced market distribution (affected by economy and natural gas resources).
