Summarize:www.chinabuses.org:
2. King Long Seat Buses
Table 4: Sales Growth Statistics Table of King Long Seat Buses in various lengths for buses in 2010
|
|
Total
|
12<L
|
11<L≤12
|
10<L≤11
|
9<L≤10
|
|
2010
|
19632
|
8
|
3629
|
1820
|
440
|
|
2009
|
12104
|
164
|
2182
|
1045
|
635
|
|
y/y growth
|
62.2
|
-95.1
|
66.3
|
74.2
|
-30.7
|
|
industry growth
|
36.3
|
-52.5
|
74.1
|
40.7
|
0.058
|
| |
8<L≤9
|
7<L≤8
|
6<L≤7
|
5<L≤6
|
|
|
2010
|
2129
|
1157
|
641
|
9808
|
|
|
2009
|
1607
|
1873
|
0
|
4598
|
|
|
|
32.5
|
-38.2
|
100
|
113.3
|
|
|
industry growth
|
42.5
|
12.8
|
-0.61
|
112.8
|
|

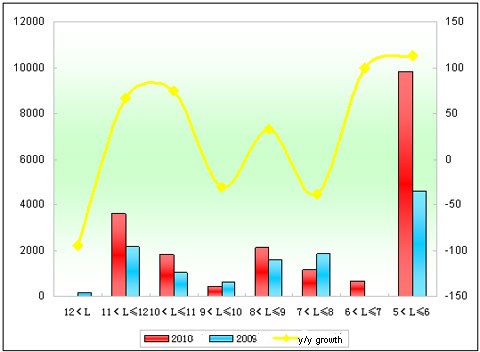
Chart 4: Sales Growth Statistics Chart of King Long Seat Buses in various lengths for buses in 2010
Shown above,
① The sales of King Long Bus seat buses increases 62.2%, almost 26 percentage higher than the growth rate of the general bus market. It indicates that the growth of King Long seat buses is the main factor for that of King Long Bus.
②The growth of King Long 11-12 meter seat buses reaches 66.3% in 2010 while almost 8 percentage less than in the industry; 8-9 meter reaches 32.5% while almost 10 percentage less than in the industry. However, it increases 5210 5-6 meter buses. It indicates that the sales of 5-6 meter buses lead to its main growth during this period of time.
Analysis of Sales Growth of City Buses in Various Lengths in 2010 and 2009
1. The Sales Growth of City Buses in Various Lengths for the Bus Industry
Table 5: Sales Growth Statistics Table of City Buses in various lengths for buses in 2010 and 2009
|
|
Total
|
12<L
|
11<L≤12
|
10<L≤11
|
9<L≤10
|
|
2010
|
62302
|
979
|
15026
|
14031
|
7599
|
|
2009
|
53581
|
1186
|
11449
|
12976
|
7437
|
|
y/y growth
|
16.3
|
-17.5
|
31.2
|
8.1
|
2.2
|
| |
8<L≤9
|
7<L≤8
|
6<L≤7
|
5<L≤6
|
3.5<L≤5
|
|
2010
|
9274
|
10052
|
2522
|
1966
|
853
|
|
2009
|
8843
|
7960
|
3390
|
340
|
0
|
|
y/y growth
|
4.9
|
26.3
|
-25.6
|
478.2
|
100
|

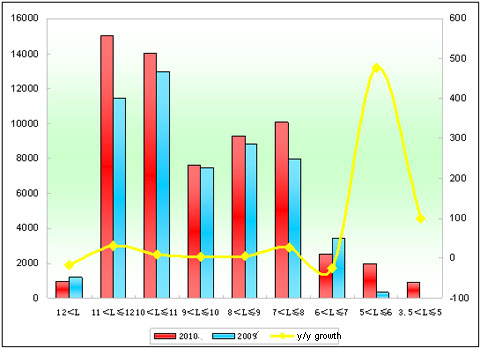
Chart 5: Sales Growth Statistics Chart of City Buses in various lengths for buses in 2010
Shown above,
The sales of city buses increases 16.3% in 2010. Apart from 6-7 meter and extra large buses,the sales of buses at all lengths show positive growth, in particular, 5-6 meter buses (478.2% growth), which indicate the great potential of rural city bus market and 11-12m city buses.
2. King Long City Buses
Table 6: Sales Growth Statistics Table of King Long City Buses in various lengths for buses in 2010
|
|
Total
|
12<L
|
11<L≤12
|
10<L≤11
|
|
2010
|
3793
|
47
|
917
|
1364
|
|
2009
|
3044
|
0
|
1879
|
665
|
|
y/y growth
|
24.6
|
100
|
-51.2
|
105.1
|
|
industry growth
|
16.3
|
-17.5
|
31.2
|
8.1
|
| |
9<L≤10
|
8<L≤9
|
7<L≤8
|
|
|
2010
|
308
|
773
|
384
|
|
|
2009
|
0
|
500
|
0
|
|
|
|
100
|
54.6
|
100
|
|
|
industry growth
|
2.2
|
4.9
|
26.3
|
|

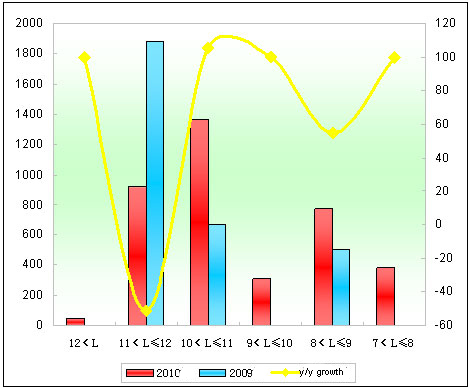
Chart 6: Sales Growth Statistics Chart of King Long City Buses in various lengths for buses in 2010
Shown above,
① The sales of King Long city buses increases 24.6% while 16.3% in the industry in 2010. The main growth shows at 10-11 meter, 8-9 meter and 7-8 meter and main decreasing shows at 11-12 meter (962 units less) and 7-8 meter (2385 units less).
② The sales of King Long extra large city buses increases 47 units while zero in Jan.-Oct.2009; negative growth in the industry.
