Summarize:www.chinabuses.org:
Analysis of Sales Growth of Bus Industry in Jan. 2011 and Jan. 2010
1. Sales Growth in Various Lengths
Table 1: Sales Growth Statistics Table in various lengths for buses in Jan. 2011
|
|
Total
|
12<L
|
11<L≤12
|
10<L≤11
|
9<L≤10
|
|
Jan.2011
|
23348
|
165
|
5229
|
2036
|
1128
|
|
Jan.2010
|
18331
|
121
|
4162
|
1771
|
725
|
|
year-on-year growth
|
27.4
|
36.4
|
25.6
|
15
|
55.6
|
| |
8<L≤9
|
7<L≤8
|
6<L≤7
|
5<L≤6
|
3.5<L≤5
|
|
Jan.2011
|
2738
|
3344
|
2350
|
1896
|
4462
|
|
Jan.2010
|
3241
|
3314
|
2605
|
1655
|
737
|
|
|
-15.5
|
0.91
|
-9.8
|
14.6
|
505.
|

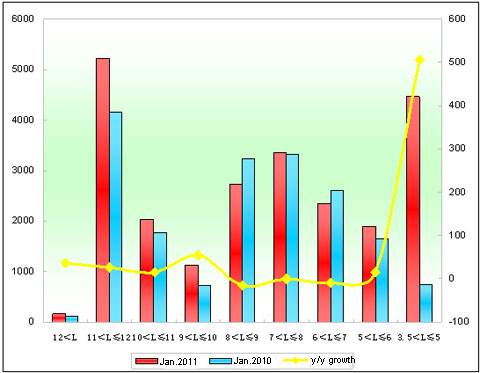
Chart 1: Sales Growth Statistics Table in various lengths for buses in Jan.2011
Shown above,
The sales goes up 27.4% in Jan.2011 than Jan.2010. In lengths, the sales of buses in all lengths (8-9m and 6-7m excluded) increase. The biggest growth show at 3.5-5 meter,and then 9-10 meter nand the smallest growth at 8-9 meter and then 6-7m buses.
2. Analysis of Sales Growth of Higer Bus in Various Lengths
Table 2: Sales Growth Statistics Table of Higer Bus in various lengths for buses in Jan. 2011
|
|
Total
|
12<L
|
11<L≤12
|
10<L≤11
|
9<L≤10
|
|
Jan.2011
|
2185
|
12
|
517
|
304
|
107
|
|
Jan.2010
|
1895
|
6
|
507
|
195
|
48
|
|
y/y growth
|
15.3
|
100
|
1.97
|
55.9
|
122.9
|
|
industry growth
|
27.4
|
36.4
|
25.6
|
15
|
55.6
|
| |
8<L≤9
|
7<L≤8
|
6<L≤7
|
5<L≤6
|
|
|
Jan.2011
|
528
|
480
|
38
|
199
|
|
|
Jan.2010
|
477
|
448
|
46
|
168
|
|
|
|
10.7
|
7.1
|
-17.4
|
18.5
|
|
|
industry growth
|
-15.5
|
0.91
|
-9.8
|
14.6
|
|

Chart 2: Sales Growth Statistics Table of Higer Bus in various lengths for buses in Jan. 2011
Shown above,
①The sales growth rate of Higer Bus is 15.3% in Jan.2011, almost 12 percentage lower than the growth speed of the industry. However, the sales growth of Higer extra large buses, 10-11m, 9-10m, 9-10m, 8-9m and 7-8m buses is higher than that of the bus industry while 11-12m and 6-7m products is lower than the industry.
②It sells 12 extra large buses in Jan.2011, 6 more units than in Jan. 2010 (6 units).
Analysis of Sales Growth of Seat Buses in Jan. 2011 and Jan. 2010
1. Sales Growth of Seat Buses in the Bus Industry
Table 3: Sales Growth Statistics Table of Seats Buses in various lengths for buses in Jan. 2011
|
|
Total
|
12<L
|
11<L≤12
|
10<L≤11
|
9<L≤10
|
|
Jan.2011
|
17747
|
56
|
3378
|
1134
|
617
|
|
Jan.2010
|
13031
|
66
|
2742
|
1157
|
405
|
|
y/y growth
|
36.2
|
-15.2
|
23.2
|
-2
|
52.3
|
| |
8<L≤9
|
7<L≤8
|
6<L≤7
|
5<L≤6
|
3.5<L≤5
|
|
Jan.2011
|
2007
|
2284
|
2054
|
1821
|
4396
|
|
Jan.2010
|
1926
|
2402
|
2243
|
1419
|
671
|
|
|
4.2
|
-4.9
|
-8.4
|
28.3
|
555.1
|

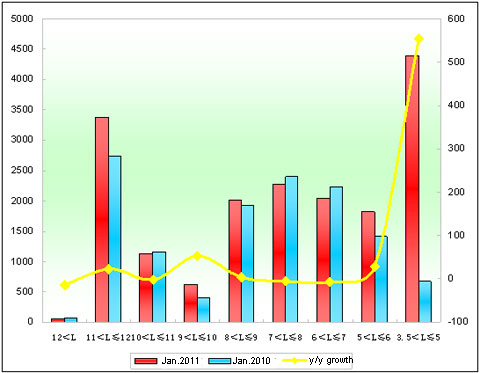
Chart 3: Sales Growth Statistics Table of Seats Buses in various lengths for buses in Jan.2011
Shown above,
The sales goes up 36.26% for seat buses in Jan.2011. In lengths, it only reduces in extra large, 7-8m and 6-7m while all increase in other lengths (the biggest growth showing at 3.5-5 meter while the smallest at 8-9 meter). It indicates that the sales increasing of seat buses is the main factor for the growth of the general bus market in the first month in 2011.
