Summarize:2. Higer Seat Buses
Table 4: Sales Growth Statistics Table of Higer Seat Buses in various lengths for buses in Jan.2011
|
|
Total
|
12<L
|
11<L≤12
|
10<L≤11
|
9<L≤10
|
|
Jan.2011
|
1722
|
2
|
443
|
205
|
69
|
|
Jan.2010
|
1458
|
5
|
413
|
173
|
22
|
|
y/y growth
|
18.1
|
-60
|
7.3
|
18.5
|
213.4
|
|
industry growth
|
36.2
|
-15.2
|
23.2
|
-2
|
52.3
|
| |
8<L≤9
|
7<L≤8
|
6<L≤7
|
5<L≤6
|
|
|
Jan.2011
|
359
|
407
|
38
|
199
|
|
|
Jan.2010
|
298
|
333
|
46
|
168
|
|
|
|
20.5
|
22.2
|
-17.4
|
18.5
|
|
|
industry growth
|
4.2
|
-4.9
|
-8.4
|
28.3
|
|

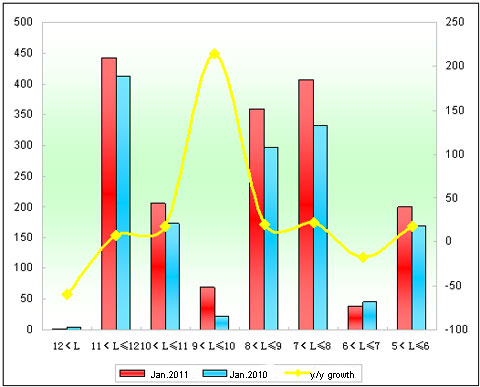
Chart 4: Sales Growth Statistics Chart of Higer Seat Buses in various lengths for buses in Jan.2011
Shown above,
① The sales of King Long Bus seat buses increases 18.1%, almost 18 percentage less than the growth rate of the bus industry, however, almost 3 percentage more than that of the general bus market. It indicates that the growth of Higer seat buses is the main factor for that of Higer Bus in Jan.2011.
②The growth of Higer 11-12 meter seat buses reaches 7.3% in Jan.2011 while 23.2% in the industry; 18.5% for 10-11 meter buses and 9-10 meter reaches the growth of 213.4% while 52.3% in the industry.
③The sales growth rate of the Higer 6-7 meter, 5-6 meter and the buses over 12 meter is lower than that of the bus industry.
Analysis of Sales Growth of City Buses in Various Lengths in Jan. 2011 and Jan.2010
1.The Sales Growth of City Buses in Various Lengths for the Bus Industry
Table 5: Sales Growth Statistics Table of City Buses in various lengths for buses in Jan.2011 and Jan.2010
|
|
Total
|
12<L
|
11<L≤12
|
10<L≤11
|
9<L≤10
|
|
Jan. 2011
|
4920
|
67
|
1232
|
902
|
507
|
|
Jan. 2010
|
4552
|
13
|
770
|
611
|
317
|
|
y/y growth
|
8.1
|
415.4
|
60
|
47.6
|
59.9
|
| |
8<L≤9
|
7<L≤8
|
6<L≤7
|
5<L≤6
|
3.5<L≤5
|
|
Jan. 2011
|
731
|
1060
|
296
|
59
|
66
|
|
Jan. 2010
|
1315
|
910
|
328
|
222
|
66
|
|
y/y growth
|
-44.4
|
16.5
|
-9.8
|
-73.4
|
0
|

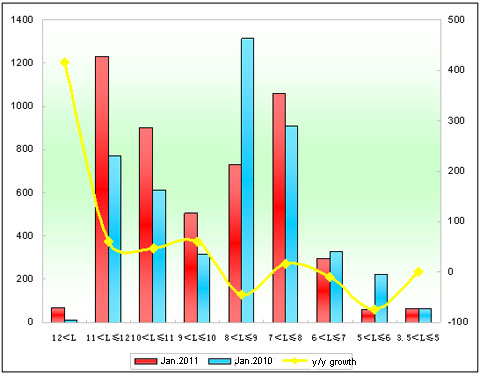
Chart 5: Sales Growth Statistics Chart of City Buses in various lengths for buses in Jan.2011
Shown above,
The sales of city buses increases 8.1% in Jan.2011. In lengths, the sales of 11-12 meter, 9-10 meter, 10-11 meter and 12 meter above buses show positive growth, while 8-9 meter and 5-6 meter decrease. The markets segment development is very uneven.
2.Higer City Buses
Table 6: Sales Growth Statistics Table of Higer City Buses in various lengths for buses in Jan.2011 and Jan. 2010
|
|
Total
|
12<L
|
11<L≤12
|
10<L≤11
|
|
Jan.2011
|
428
|
10
|
39
|
99
|
|
Jan.2010
|
396
|
0
|
54
|
22
|
|
y/y growth
|
8.1
|
100
|
-27.8
|
350
|
|
industry growth
|
8.1
|
415.4
|
60
|
47.6
|
| |
9<L≤10
|
8<L≤9
|
7<L≤8
|
|
|
Jan.2011
|
38
|
169
|
73
|
|
|
Jan.2010
|
26
|
179
|
115
|
|
|
|
46.2
|
-5.6
|
-36.5
|
|
|
industry growth
|
59.9
|
-44.4
|
16.5
|
|

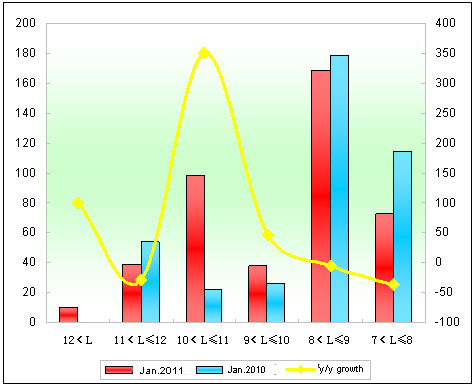
Chart 6: Sales Growth Statistics Chart of Higer City Buses in various lengths for buses in Jan.2011 and Jan.2010
Shown above,
①The sales of Higer city buses increases 8.1% (almost 400 units more than in Jan.2010) in Jan. 2011. Its growth rate is lower than Yutong, King Long and Golden Dragon.
②The main growth shows at 10-11 meter (77 units more),9-10 meter (12 units more) while it decreases in other lengths.
③The sales volume of Higer extra large city buses is 10 units while zero in Jan.2010.
