Summarize:www.chinabuses.org:
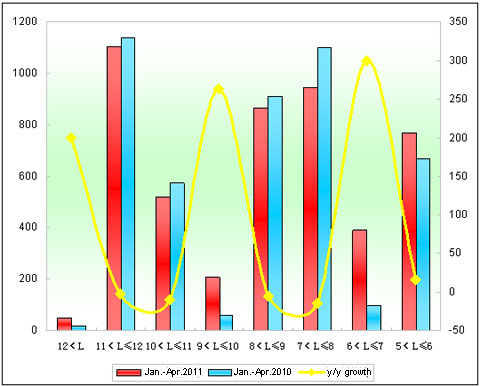
Table 4: Sales Growth Statistics Table of Higer Seat Buses in various lengths for buses in Jan.-Apr. 2011
|
|
Total
|
12<L
|
11<L≤12
|
10<L≤11
|
9<L≤10
|
|
Jan.-Apr. 2011
|
4848
|
48
|
1104
|
518
|
207
|
|
Jan.-Apr. 2010
|
4558
|
16
|
1137
|
574
|
57
|
|
year-on-year growth
|
6.4
|
200
|
-2.9
|
-9.8
|
263
|
|
industry growth
|
18.9
|
29.6
|
3.4
|
-0.5
|
43.2
|
| |
8<L≤9
|
7<L≤8
|
6<L≤7
|
5<L≤6
|
|
|
Jan.-Apr. 2011
|
864
|
946
|
391
|
770
|
|
|
Jan.-Apr. 2010
|
909
|
1099
|
98
|
668
|
|
|
|
-5
|
-14
|
299
|
15
|
|
|
industry growth
|
4.3
|
-3.7
|
-1
|
-14.3
|
|

Chart 4: Sales Growth Statistics Chart of Higer Seat Buses in various lengths for buses in Jan.-Apr. 2011
Shown above,
① The sales of Higer Bus seat buses increases 6.4%, almost 12.5 percentage less than the growth rate of the bus industry, however, almost 1.7 percentage less than that of its general bus market. It indicates that the growth of Higer seat buses is not the main factor for that of Higer Bus in Jan.-Apr.2011.
②The growth of Higer 11-12 meter seat buses reaches -2.9% in Jan.-Apr.2011 while 3.4% in the industry. The sales decreasing show at 10-11m, 8-9m, and 7-8m.
③The sales growth rate of the buses with 12 meter above is the biggest and the base is small.
Analysis of Sales Growth of City Buses in Various Lengths in Jan.-Apr. 2011 and Jan.-Apr. 2010
1.The Sales Growth of City Buses in Various Lengths for the Bus Industry
Table 5: Sales Growth Statistics Table of City Buses in various lengths for buses in Jan.-Apr. 2011 and Jan.-Apr. 2010
|
|
Total
|
12<L
|
11<L≤12
|
10<L≤11
|
9<L≤10
|
|
Jan.-Apr. 2011
|
16512
|
472
|
4099
|
3555
|
1938
|
|
Jan.-Apr. 2010
|
16381
|
264
|
3841
|
3025
|
1843
|
|
year-on-year growth
|
0.8
|
78.8
|
6.7
|
17.5
|
5.2
|
| |
8<L≤9
|
7<L≤8
|
6<L≤7
|
5<L≤6
|
3.5<L≤5
|
|
Jan.-Apr. 2011
|
2023
|
3267
|
811
|
133
|
214
|
|
Jan.-Apr. 2010
|
3013
|
2721
|
900
|
530
|
244
|
|
year-on-year growth
|
-32.9
|
20.1
|
-9.9
|
-74.9
|
-12.3
|

Chart 5: Sales Growth Statistics Chart of City Buses in various lengths for buses in Jan.-Apr. 2011
Shown above,
The sales of city buses increases 0.8% in Jan.-Apr.2011. In lengths, the sales of 8-9 meter and 5-6 meter, 6-7meter, 3.5-5 meter decrease.
2.Higer City Buses
Table 6: Sales Growth Statistics Table of Higer City Buses in various lengths for buses in Jan.-Apr. 2011 and Jan.-Apr. 2010
|
|
Total
|
12<L
|
11<L≤12
|
10<L≤11
|
|
Jan.-Apr. 2011
|
1792
|
10
|
576
|
341
|
|
Jan.-Apr. 2010
|
1573
|
6
|
297
|
501
|
|
year-on-year growth
|
13.9
|
66.7
|
94
|
-32
|
|
industry growth
|
0.8
|
78.8
|
6.7
|
17.5
|
| |
9<L≤10
|
8<L≤9
|
7<L≤8
|
|
|
Jan.-Apr. 2011
|
317
|
269
|
279
|
|
|
Jan.-Apr. 2010
|
166
|
361
|
242
|
|
|
|
91
|
-25.5
|
15.3
|
|
|
industry growth
|
5.2
|
-32.9
|
20.1
|
|

Chart 6: Sales Growth Statistics Chart of Higer City Buses in various lengths for buses in Jan.-Apr. 2011 and Jan.-Apr. 2010
Shown above,
①The sales of Higer city buses increases 13.9% (219 units more than in Jan.-Apr.2010) in Jan.-Apr.2011. Its growth rate of city buses is comparatively higher among Yutong, King Long and Golden Dragon and Higer.
②The main growth shows at 9-10 meter (151 units more; 91% growth); 11-12 meter (279 units more; 66.7% growth); 7-8 meter (37 units; 15.3% up) while it decreases in 8-9meter and 10-11 meter.
③The sales volume of Higer extra large city buses is 10 units while 6 units in Jan.-Apr. 2010.
