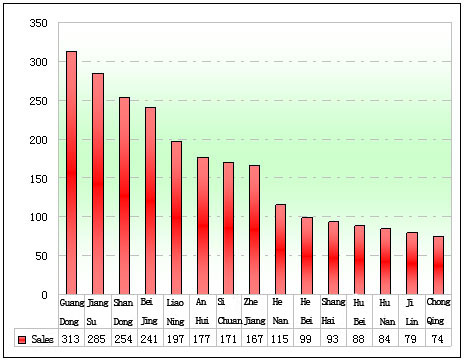
Summarize:www.chinabuses.org: Demand drivers’ reduction lowers the concentration of key regions; developed region as key sales market of new energy buses, regional distribution is unbalanced.
Table 3: Regional Market Sales Table in the first half of 2011
|
|
Regions
|
Sales
|
Shares
|
Growth
amplitude
|
|
1
|
Guangdong
|
313
|
10.44
|
-0.33
|
|
2
|
Jiangsu
|
285
|
9.5
|
0.08
|
|
3
|
Shandong
|
254
|
8.47
|
0.06
|
|
4
|
Beijing
|
241
|
8.04
|
-0.08
|
|
5
|
Liaoning
|
197
|
6.57
|
0.01
|
|
6
|
Anhui
|
177
|
5.9
|
0.2
|
|
7
|
Sichuan
|
171
|
5.7
|
0.05
|
|
8
|
Zhejiang
|
167
|
5.57
|
0.08
|
|
9
|
Henan
|
115
|
3.84
|
0.13
|
|
10
|
Hebei
|
99
|
3.3
|
0.02
|
|
11
|
Shanghai
|
93
|
3.1
|
-2.2
|
|
12
|
Hubei
|
88
|
2.94
|
0.05
|
|
13
|
Hunan
|
84
|
2.8
|
0.06
|
|
14
|
Jilin
|
79
|
2.64
|
0.07
|
|
15
|
Chongqing
|
74
|
2.47
|
0.09
|
|
|
Total
|
2437
|
81.29
|
-2.01
|

Chart 3: Regional Market Sales Chart in the first half of 2011
We can see from above table and chart that:
1. Guangdong takes the largest market share (10.44%) in the first half of 2011, because of the demands of Shenzhen, Guangzhou for new energy buses. 0.33% less than that of 2010 is due to the lack of the promotion of major events like the 16th Asian Games.
2. Shanghai market share decreases the most (-2.2%) in the first half of 2011, due to the lacking of major event like 2010 Shanghai World Expo in 2011.
3. Henan market share increases the most (0.13%), for local bus enterprise Yutong intensifies R & D investment and marketing promotion.
4. The top 6 sales volume areas are Guangdong, Jiangsu, Shandong, Beijing, Liaoning and Anhui, key strategic areas for the promotion of new energy buses development.
5. Total base of new energy buses sales volume is small. In market demand, new energy buses can’t rival conventional models, but are developing very fast.
6. Total sales volume of new energy buses in the top 15 regional markets account for 81.29% of market shares, 2.01% less than that of the first half of 2010 and another 18 regional markets (excluding Taiwan) account for 18.71%, so new energy buses market is unbalanced distributed.
Conclusion: with high concentration of sales region and unbalanced distribution, sales volume of new energy buses is large in developed and policy-supported areas. In contrast with 2010, the concentration of key regions lowers mainly because of demand drivers’ reduction.
