Summarize:www.chinabuses.org:
Table 4: Sales Growth Statistics Table of Higer Seat Buses in various lengths for buses in Jan.-July 2011
|
|
Total
|
12<L
|
11<L≤12
|
10<L≤11
|
9<L≤10
|
|
Jan.-July 2011
|
8744
|
96
|
2026
|
925
|
316
|
|
Jan.-July 2010
|
8117
|
29
|
1886
|
1077
|
128
|
|
|
7.7
|
231
|
7.4
|
-14.1
|
146.9
|
|
industry growth
|
15
|
46.5
|
12.1
|
0.29
|
19.1
|
| |
8<L≤9
|
7<L≤8
|
6<L≤7
|
5<L≤6
|
|
|
Jan.-July 2011
|
1596
|
1753
|
560
|
1472
|
|
|
Jan.-July 2010
|
1540
|
1935
|
143
|
1379
|
|
|
|
3.6
|
-9.4
|
291.6
|
6.7
|
|
|
industry growth
|
7.9
|
0.7
|
0.86
|
-26.2
|
|

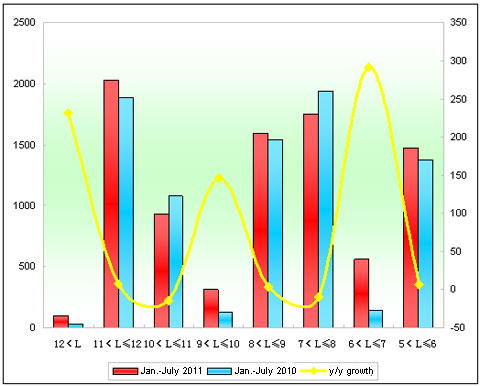
Chart 4: Sales Growth Statistics Chart of Higer Seat Buses in various lengths for buses in Jan.-July 2011
Shown above,
① The sales of Higer Bus seat buses increases 7.7%, almost 7.3 percentage less than the growth rate of the bus industry. It indicates that the growth of Higer seat buses is not the main factor for that of Higer Bus in Jan.-July 2011.
②The growth of Higer 11-12 meter seat buses reaches 7.4% in Jan.-July 2011 and the sales growth of extra large buses (231.0% up) is far more higher than the industry, and 9-10 meter (146.9% up).
③ The growth of Higer 6-7 meter seat buses reaches 291.6% (the biggest growth),and 5-6m (6.7% up) while negative growth in the bus industry. The sales of the 7-8m buses show the trend of decreasing.
Analysis of Sales Growth of City Buses in Various Lengths in Jan.-July 2011 and Jan.-July 2010
1.The Sales Growth of City Buses in Various Lengths for the Bus Industry
|
|
Total
|
12<L
|
11<L≤12
|
10<L≤11
|
9<L≤10
|
|
Jan.-July 2011
|
34921
|
1345
|
8489
|
7931
|
3336
|
|
Jan.-July 2010
|
30907
|
846
|
6657
|
6843
|
3816
|
|
year-on-year growth
|
13
|
59
|
27.5
|
15.9
|
-12.6
|
| |
8<L≤9
|
7<L≤8
|
6<L≤7
|
5<L≤6
|
|
|
Jan.-July 2011
|
4590
|
6349
|
1918
|
439
|
|
|
Jan.-July 2010
|
5093
|
4793
|
1384
|
1037
|
|
|
year-on-year growth
|
-9.9
|
32.5
|
38.6
|
-57.7
|
|

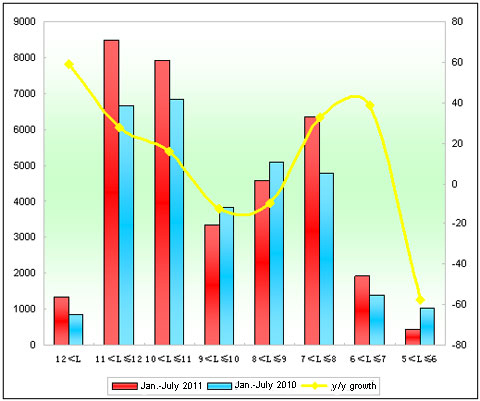
Chart 5: Sales Growth Statistics Chart of City Buses in various lengths for buses in Jan.-July 2011
Shown above,
The sales of city buses increases 13% in Jan.-July 2011. In lengths, the sales of 9-10 meter, 8-9 meter and 5-6 meter decrease while others increase. In particular, the biggest fall is shown at 5-6 meter falls and the biggest growth at the extra large buses.
2.Higer City Buses
Table 6: Sales Growth Statistics Table of Higer City Buses in various lengths for buses in Jan.-July 2011 and Jan.-July 2010
|
|
Total
|
12<L
|
11<L≤12
|
10<L≤11
|
|
Jan.-July 2011
|
3640
|
13
|
1251
|
982
|
|
Jan.-July 2010
|
2747
|
6
|
690
|
830
|
|
|
32.5
|
116.7
|
81.3
|
18.3
|
|
industry growth
|
13
|
59
|
27.5
|
15.9
|
| |
9<L≤10
|
8<L≤9
|
7<L≤8
|
|
|
Jan.-July 2011
|
447
|
505
|
442
|
|
|
Jan.-July 2010
|
265
|
624
|
332
|
|
|
year-on-year growth
|
68.7
|
-19.1
|
33.1
|
|
|
industry growth
|
-12.6
|
-9.9
|
32.5
|
|

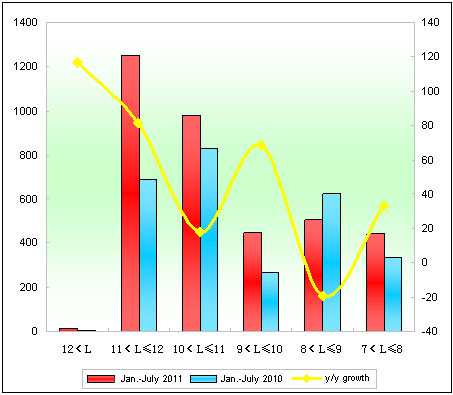
Chart 6: Sales Growth Statistics Chart of City Buses in various lengths for buses in Jan.-July 2011 and Jan.-July 2010
Shown above,
①The sales of Higer city buses increase 32.5% (893 units more than in Jan.-July 2010) in Jan.-July 2011. The growth of city buses contributes to the increasing of the sales of Higer Bus.
②The main growth shows at 11-12 meter (561 units more), 9-10 meter, 7-8 meter, and 10-11 meter.
③The decreasing of the sales is shown at 8-9meter (19.1% down), also negative growth in the bus industry.
