Summarize:www.chinabuses.org:
Analysis of Sales Growth of Bus Industry in Jan.-July 2011 and Jan. -July 2010
1. Sales Growth in Various Lengths
Table 1: Sales Growth Statistics Table in various lengths for buses in Jan.-July 2011
|
|
Total
|
12<L
|
11<L≤12
|
10<L≤11
|
9<L≤10
|
|
Jan.-July 2011
|
124226
|
1739
|
24561
|
14236
|
6448
|
|
Jan.-July 2010
|
108939
|
1132
|
21298
|
13135
|
6409
|
|
|
14
|
53.6
|
15.3
|
8.4
|
0.6
|
| |
8<L≤9
|
7<L≤8
|
6<L≤7
|
5<L≤6
|
3.5<L≤5
|
|
Jan.-July 2011
|
14362
|
19037
|
15515
|
10038
|
18290
|
|
Jan.-July 2010
|
14153
|
17369
|
14998
|
13664
|
6781
|
|
|
1.5
|
9.6
|
3.4
|
-26.5
|
169.7
|

Chart 1: Sales Growth Statistics Table in various lengths for buses in Jan.-July 2011
Shown above,
The sales goes up 14.0% in Jan.-July 2011 than Jan.-July 2010. In lengths, the sales of buses show positive growth at all lenghts except the buses with 5-6 meter. The biggest growth show at 3.5-5 meter (169.7%) and extra large buses (53.6%), 11-12 meter (15.3%) and 9-10 meter (0.6%).
2. Analysis of Sales Growth of Yutong Bus in Various Lengths
Table 2: Sales Growth Statistics Table of Yutong Bus in various lengths for buses in Jan. -July 2011
|
|
Total
|
12<L
|
11<L≤12
|
10<L≤11
|
|
Jan.-July 2011
|
22830
|
474
|
7047
|
2404
|
|
Jan.-July 2010
|
20002
|
165
|
5881
|
2249
|
|
|
14.1
|
187.2
|
19.8
|
6.9
|
|
industry growth
|
14
|
53.6
|
15.3
|
8.4
|
| |
9<L≤10
|
8<L≤9
|
7<L≤8
|
6<L≤7
|
|
Jan.-July 2011
|
1456
|
4575
|
5106
|
1768
|
|
Jan.-July 2010
|
1432
|
3824
|
4292
|
2159
|
|
|
1.67
|
19.6
|
19
|
-18.1
|
|
industry growth
|
0.6
|
1.5
|
9.6
|
3.4
|

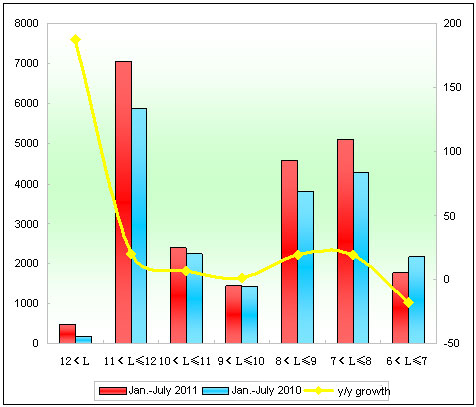
Chart 2: Sales Growth Statistics Table of Yutong Bus in various lengths for buses in Jan-July 2011
Shown above,
①The sales growth rate of Yutong Bus is 14.1% in Jan.-July 2011, almost 0.1 percentage higher than the growth speed of the industry.
②The sales of extra large buses (above 12 meter) increase 187.2%, of 11-12 meter grow 19.8% (1166 units more), almost 4.5 percentage more than the industry. The sales of 6-7 meter buses fall.
③The sales of 8-9 meter buses increase 751 units than Jan.-July 2010.
④It is only the sales of 6-7 meter falling while positive growth in the bus industry.
Analysis of Sales Growth of Seat Buses in Jan.-July 2011 and Jan.-July 2010
1. Sales Growth of Seat Buses in the Bus Industry
Table 3: Sales Growth Statistics Table of Seats Buses in various lengths for buses in Jan.-July 2011
|
|
Total
|
12<L
|
11<L≤12
|
10<L≤11
|
9<L≤10
|
|
Jan.-July 2011
|
87076
|
274
|
14408
|
6294
|
3045
|
|
Jan.-July 2010
|
75727
|
187
|
12848
|
6276
|
2557
|
|
|
15
|
46.5
|
12.1
|
0.29
|
19.1
|
| |
8<L≤9
|
7<L≤8
|
6<L≤7
|
5<L≤6
|
3.5<L≤5
|
|
Jan.-July 2011
|
9762
|
12639
|
13565
|
9329
|
17760
|
|
Jan.-July 2010
|
9048
|
12551
|
13449
|
12468
|
6343
|
|
year-on-year growth
|
7.9
|
0.7
|
0.86
|
-26.2
|
180
|

Chart 3: Sales Growth Statistics Table of Seats Buses in various lengths for buses in Jan.-July 2011
Shown above,
The sales goes up 15% for seat buses in Jan.-July 2011, 1 percentage higher than the growth speed of the bus industry. In lengths, it reduces in 5-6m and shows the positive growth at others, in particular, 3.5-5 meter light buses.
Analysis of Sales Growth of Yutong Seat Buses
Table 2: Sales Growth Statistics Table of Yutong Seat Buses in various lengths for buses in Jan. -July 2011
|
|
Total
|
12<L
|
11<L≤12
|
10<L≤11
|
|
Jan.-July 2011
|
16483
|
58
|
4554
|
1694
|
|
Jan.-July 2010
|
15061
|
69
|
3676
|
1558
|
|
|
9.4
|
-15.9
|
23.9
|
8.7
|
|
industry growth
|
15
|
46.5
|
12.1
|
0.29
|
| |
9<L≤10
|
8<L≤9
|
7<L≤8
|
6<L≤7
|
|
Jan.-July 2011
|
1095
|
3312
|
4003
|
1767
|
|
Jan.-July 2010
|
1027
|
2995
|
3577
|
2159
|
|
|
6.6
|
10.6
|
11.9
|
-18.2
|
|
industry growth
|
19.1
|
7.9
|
0.7
|
0.86
|

Sales Growth Statistics Chart of Yutong Seat Buses in various lengths for buses in Jan. -July 2011
Shown above,
①The sales growth rate of Yutong seat buses is 9.4% in Jan.-July 2011, almost 5.6 percentage lower than the growth speed of the industry. It indicated that the sales of seat buses is not the major factor for the overall growth of Yutong Bus.
②The sales of extra large seat buses (above 12 meter) decrease 15.9% while positive growth in the bus industry; of 11-12 meter grow 23.9%; of 10-11 meter grow 8.7%; of 9-10 meter grow 6.6%; of 8-9 meter grow 10.6%; of 7-8 meter grow 11.9%; of 6-7 meter fall 18.2%.
③The sales of 8-9 meter buses increase 751 units than Jan.-July 2010.
④It is only the sales of 6-7 meter falling while positive growth in the bus industry.
