Summarize:www.chinabuses.org: III City Bus Sales Growth Analysis of Different Lengths by Comparison of the first 8 months of 2011 and 2010
1. Industry City Bus Sales Growth Condition of Different Lengths
Table 5: City Bus Sales Growth Table of Different Lengths in the first 8 Months of 2011
|
|
total
|
12<L
|
11<L≤12
|
10<L≤11
|
9<L≤10
|
|
the first 8 months of 2011
|
40955
|
1493
|
9926
|
9336
|
3912
|
|
the first 8 months of 2010
|
36391
|
698
|
8546
|
8039
|
4387
|
|
year-on-year rise
|
12.5
|
113.9
|
16.1
|
16.1
|
-10.8
|
| |
8<L≤9
|
7<L≤8
|
6<L≤7
|
5<L≤6
|
|
|
the first 8 months of 2011
|
5683
|
7324
|
2165
|
541
|
|
|
the first 8 months of 2010
|
5747
|
5630
|
1642
|
1242
|
|
|
year-on-year rise
|
-1.1
|
30.1
|
31.9
|
-56.4
|
|

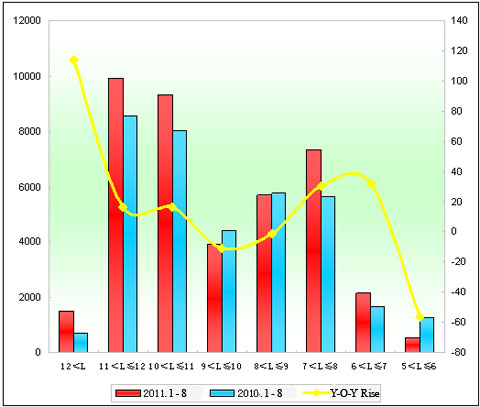
Chart 5: City Bus Sales Growth Chart of Different Lengths in the first 8 Months of 2011
We can see from the above that:
Sales of city buses increase by 12.5% in the first 8 months of 2011. From the lengths we can see that 8-9 meters and 5-6 meters are negative growth, others are positive growth. Sales of super large city buses increase the most which reflects the growth potential of super large city bus market; then 6-7 meters city buses, which reflects the market demand of urban-rural routes. Sales of city buses increase slower than those of seat buses, even industrial average, which is one of the negative elements.
2. Zhengzhou Yutong City Buses
Table 6: Zhengzhou Yutong City Bus Sales Growth Table of Different Lengths in the first 8 Months of 2011
|
|
total
|
12<L
|
11<L≤12
|
10<L≤11
|
|
the first 8 months of 2011
|
6164
|
349
|
1680
|
818
|
|
the first 8 months of 2010
|
4632
|
71
|
1455
|
793
|
|
year-on-year rise
|
33.1
|
391.5
|
15.5
|
3.15
|
|
industry rise
|
12.5
|
113.9
|
16.1
|
16.1
|
| |
9<L≤10
|
8<L≤9
|
7<L≤8
|
6<L≤7
|
|
the first 8 months of 2011
|
452
|
1592
|
1272
|
1
|
|
the first 8 months of 2010
|
486
|
991
|
836
|
0
|
|
year-on-year rise
|
-7
|
60.6
|
52.2
|
100
|
|
industry rise
|
-10.8
|
-1.1
|
30.1
|
31.9
|

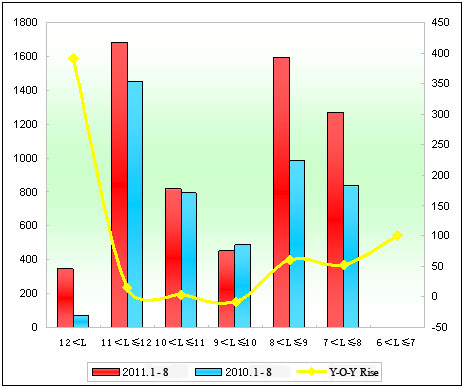
Chart 6: Zhengzhou Yutong City Bus Sales Growth Chart of Different Lengths in the first 8 Months of 2011
We can see from the above that:
(1) Sales of Yutong city buses increase 33.1%, 21% more than industrial average, which means sales of Yutong city buses increase much faster than industrial average.
(2) Sales of Yutong 11-12 meters city buses increase 235 units, rising by 15.5%, close to industrial average 16.1%. Sales of super large city buses increase 178 units, rising by 391.5%, which industrial average is 113.9%, which shows the leading role of Yutong in super large city buses.
(3) Compared with industrial average, sales of 8-9 meters city buses are increasing rapidly, which is one advantage of Yutong.
IV. Sleeper Bus Sales Growth Analysis of Different Lengths by Comparison of the first 8 months of 2011 and 2010
1. Industry Sleeper Bus Sales Growth Condition of Different Lengths
Table 7: Sleeper Bus Sales Growth Table of Different Lengths in the first 8 Months of 2011
|
|
total
|
12<L
|
11<L≤12
|
10<L≤11
|
|
the first 8 months of 2011
|
2014
|
94
|
1909
|
11
|
|
the first 8 months of 2010
|
2116
|
107
|
1993
|
16
|
|
year-on-year rise
|
-4.8
|
-12.1
|
-4.2
|
-31.3
|
We can see from the above that:
Compared with those in the first 8 months of 2010, sales of sleeper buses in the first 8 months of 2011 are decreasing, by 4.8%. 11-12 meters sleeper buses as the main products decrease the most, up to 84 units. Meanwhile, we can see that sleeper bus is apt to be taken off bus market.
2. Zhengzhou Yutong Sleeper Bus
Table 8: Zhengzhou Yutong Sleeper Bus Sales Growth Table of Different Lengths in the first 8 Months of 2011
|
|
total
|
12<L
|
11<L≤12
|
|
the first 8 months of 2011
|
1114
|
42
|
1072
|
|
the first 8 months of 2010
|
1119
|
27
|
1092
|
|
year-on-year rise
|
-0.45
|
55.6
|
-1.83
|
|
industry rise
|
-4.8
|
-12.1
|
-4.2
|
We can see from the above that:
(1) 2014 units of sleeper buses are sold in the first 8 months of 2011 including 1114 units of Yutong sleeper buses, year-on-year rises of -0.45%, accounting for 55.3% of market share.
(2) Sales of Yutong sleeper buses in the first 8 months of 2010 are 1119 units, accounting for 52.9% of market share, comparing to which sales in the first 8 months of 2011 increase, up to 2.4%, which means the strengthening of Yutong’s monopoly position in sleeper buses in the first 8 months of 2011 and the support to the increasing of Yutong’s profits.
(3) Yutong sleeper buses are mainly 11-12 meters and medium buses are eliminated. Sales of over-12-meter sleeper buses are 42 units, year-on-year rises of 15 units, rising by 55.6% while industrial average is decreasing by 12.1%, which shows the leading role of Yutong in super large sleeper bus.
