Summarize:www.chinabuses.org:
2.Xiamen King Long Seat Buses
Table 4: Sales Growth Statistics Table of King Long Seat Buses in various lengths in the first three quarters of 2011 and 2010
|
|
Total
|
12<L
|
11<L≤12
|
10<L≤11
|
9<L≤10
|
|
The first three quarters of 2011
|
14687
|
11
|
3109
|
1449
|
424
|
|
The first three quarters of 2010
|
14289
|
1
|
2756
|
1389
|
305
|
|
Year-on-year growth
|
2.7
|
1000
|
12.8
|
4.3
|
39
|
|
Industry growth
|
15.8
|
44.1
|
15.7
|
5.4
|
23.1
|
|
|
8<L≤9
|
7<L≤8
|
6<L≤7
|
5<L≤6
|
3.5<L≤5
|
|
The first three quarters of 2011
|
1687
|
574
|
345
|
559
|
6529
|
|
The first three quarters of 2010
|
1600
|
861
|
492
|
6885
|
0
|
|
Year-on-year growth
|
5.4
|
-33.3
|
-29.8
|
-91.9
|
100
|
|
Industry growth
|
8.2
|
5.1
|
-0.19
|
-24.7
|
157.1
|

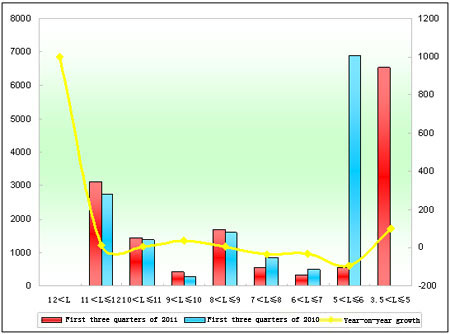
Chart 4: Sales Growth Statistics Chart of King Long Seat Buses in various lengths in the first three quarters of 2011 and 2010
From the above data, it is seen that
①Sales of King Long Seats Buses grow by 2.7% in the first three quarters of 2011 which is respectively nearly 13.0% and 2.8% lower than the industry sales growth and its overall sales growth. It shows the sales growth of King Long seat buses decrease in the first three quarters of 2011 which is not the main force of the King Long bus sales growth in first three quarters of 2011.
②From the lengths, the sales of over 8m seat Buses is in positive growth while the 5-8m seat buses in negative growth and the growth amount of 3.5-5m light bus is same as the decrease amount of 5-8m seat buses. Besides, King Long sold 11 over 12m large seat buses in the first three quarters of 2011 while it is 1 large seat bus in 2010, which grows by 1000% that is favorable for the profit growth.
Analysis of Sales Growth of City Buses in Various Lengths in the First Three Quarters of 2011 and 2010
1.The Sales Growth of City Buses in Various Lengths for the Bus Industry
Table 5: Sales Growth Statistics Table of City Buses in various lengths in the first three quarters of 2011 and 2010
|
|
Total
|
12<L
|
11<L≤12
|
10<L≤11
|
9<L≤10
|
|
|
47338
|
1722
|
11447
|
10678
|
4778
|
|
The first three quarters of 2010
|
42612
|
750
|
10516
|
8999
|
5177
|
|
|
11.1
|
129.6
|
8.9
|
18.7
|
-7.7
|
|
|
8<L≤9
|
7<L≤8
|
6<L≤7
|
5<L≤6
|
|
|
The first three quarters of 2011
|
6801
|
8164
|
2434
|
670
|
|
|
The first three quarters of 2010
|
6812
|
6610
|
1775
|
1417
|
|
|
Year-on-year growth
|
-0.16
|
23.5
|
37.1
|
-52.7
|
|

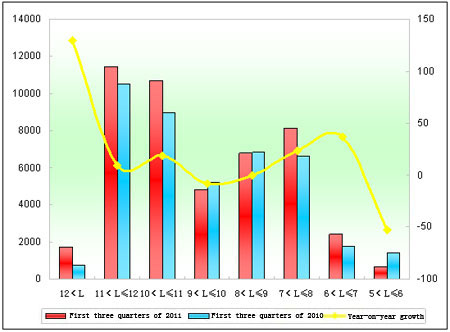
Chart 5: Sales Growth Statistics Chart of City Buses in various lengths in the first three quarters of 2011 and 2010
From the above data, it is seen that
The sales of city buses increases 11.1% in the first three quarters of 2011 whose growth is lower than the growth of overall industry and the seat buses, which means the citybuses sales growth is the main factor that limits the sales growth of the bus industry. From the lengths, it is seen the max sales growth is the large bus; the second is 6-7m city buses; the third is 7-8m city buses. The sales of city buses at all lengths show positive sales growth, apart from 9-10m, 8-9m and 5-6m city buses.
2. King Long City Buses
Table 6: Sales Growth Statistics Table of King Long City Buses in various lengths in the first three quarters of 2011 and 2010
|
|
Total
|
12<L
|
11<L≤12
|
10<L≤11
|
|
The first three quarters of 2011
|
3044
|
315
|
688
|
1114
|
|
The first three quarters of 2010
|
2588
|
44
|
639
|
748
|
|
Year-on-year growth
|
17.6
|
615.9
|
7.7
|
48.9
|
|
Industry growth
|
11.1
|
129.6
|
8.9
|
18.7
|
|
|
9<L≤10
|
8<L≤9
|
7<L≤8
|
|
|
The first three quarters of 2011
|
282
|
376
|
269
|
|
|
The first three quarters of 2010
|
207
|
599
|
351
|
|
|
Year-on-year growth
|
36.2
|
-37.2
|
-23.3
|
|
|
Industry growth
|
-7.7
|
-0.16
|
23.5
|
|

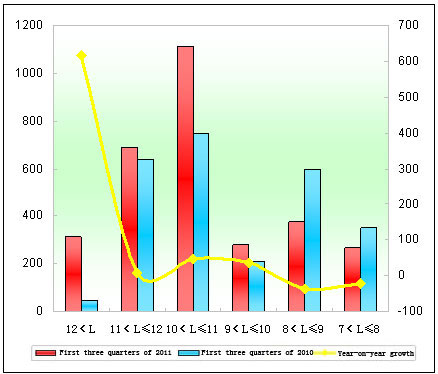
Chart 6: Sales Growth Statistics Chart of King Long City Buses in various lengths in the first three quarters of 2011 and 2010
From the above data, it is seen that
①The sales of King Long city buses increases by 17.6% while by 11.1% in the bus industry in the first three quarters of 2011 which is nearly 12.1% more than the sales growth of the overall bus market. It is seen the main force of the sales growth of the King Long is not the sales growth of seat buses but the city buses.
②From the lengths, it is seen the sales of King Long city buses increases 277 units which it is much more than the bus industry. The sales growth of 9-10m bus and 10-11m bus respectively increases by 36.2% and 48.9% but the bus industry is -7.7% and 18.7%, especially 8-9m and 7-8m which is in negative growth. However, the sales growth of the King Long 11-12m large city buses is lower than the sales growth of the bus industry.
