Summarize:www.chinabuses.org:I Bus Industry Sales Growth Analysis by Comparison of the first 10 Months of 2011 and 2010
1. Overall Sales Growth Condition of Different Lengths
Table 1: Sales Growth Table of Different Lengths in the first 10 Months of 2011
|
|
Total
|
12<L
|
11<L≤12
|
10<L≤11
|
9<L≤10
|
|
First 10 months of 2011
|
188314
|
2556
|
36691
|
21865
|
10302
|
|
First 10 months of 2010
|
164694
|
1254
|
33108
|
19664
|
9713
|
|
Y-O-Y rise
|
14.34
|
103.8
|
10.8
|
11.2
|
6.06
|
| |
8<L≤9
|
7<L≤8
|
6<L≤7
|
5<L≤6
|
3.5<L≤5
|
|
First 10 months of 2011
|
22485
|
28294
|
23398
|
14896
|
27827
|
|
First 10 months of 2010
|
21054
|
25781
|
22583
|
20451
|
11086
|
|
Y-O-Y rise
|
6.8
|
9.7
|
3.6
|
-27.2
|
151
|

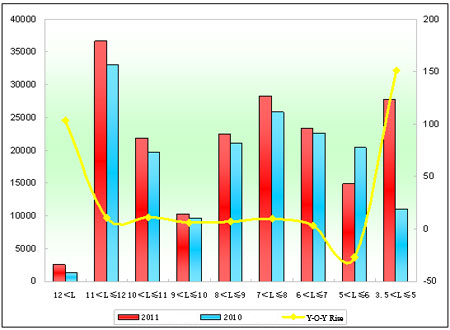
Chart 1: Sales Growth Chart of Different Lengths in the first 10 Months of 2011
We can see from the above that:
Overall sales in the first 10 months of 2011 increase 14.34%. From the lengths we can see that sales of every length grow except 5-6 meters and it is the 10th consecutive growth, which means national economic environment keeps influencing the bus market. The max growth is 3.5-5 meters light bus; then over-12-meter super large bus. Sales of 5-6 meters rural bus decrease the most.
2. Zhengzhou Yutong Sales Growth Analysis of Different Lengths
Table 2: Zhengzhou Yutong Sales Growth Table of Different Lengths in the first 10 Months of 2011
|
|
Total
|
12<L
|
11<L≤12
|
10<L≤11
|
|
First 10 months of 2011
|
34848
|
637
|
10480
|
3885
|
|
First 10 months of 2010
|
31066
|
228
|
9245
|
3543
|
|
Y-O-Y rise
|
12.2
|
179.4
|
13.4
|
9.7
|
|
Industry rise
|
14.34
|
103.8
|
10.8
|
11.2
|
| |
9<L≤10
|
8<L≤9
|
7<L≤8
|
6<L≤7
|
|
First 10 months of 2011
|
2790
|
7146
|
7390
|
2520
|
|
First 10 months of 2010
|
2199
|
6181
|
6585
|
3085
|
|
Y-O-Y rise
|
26.9
|
15.6
|
12.2
|
-18.3
|
|
Industry rise
|
6.06
|
6.8
|
9.7
|
3.6
|

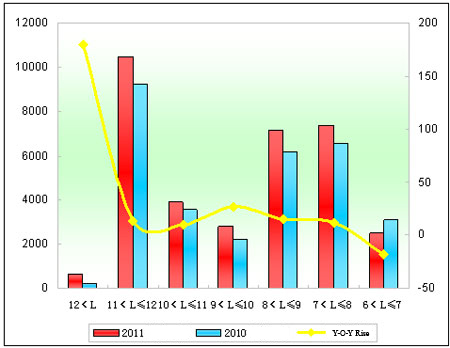
Chart 2: Zhengzhou Yutong Sales Growth Chart of Different Lengths in the first 10 Months of 2011
We can see from the above that:
(1) Sales of Yutong bus in the first 10 months of 2011 increase 12.2%, 2.1% less than industrial average, which means growth of Yutong bus slows down.
(2) Except 6-7 meters, sales of other lengths of Yutong bus increase, especially super large bus, then 9-10 meters, increasing 179.4% and 26.9% respectively.
(3) Sales of Yutong super large buses increase 179.4% while industrial average is 103.8%, which lives up to the leading role of Yutong in bus industry.
(4) 11-12 meters buses are sold 10480 units, growing faster than industrial average, which means Yutong is still unrivaled in large buses.
II Seat Bus Sales Growth Analysis of Different Lengths by Comparison of the first 10 months of 2011 and 2010
1. Industry Seat Bus Sales Growth Condition of Different Lengths
Table 3: Seat Bus Sales Growth Table of Different Lengths in the first 10 Months of 2011
| |
Total
|
12<L
|
11<L≤12
|
10<L≤11
|
9<L≤10
|
|
First 10 months of 2011
|
132377
|
472
|
21922
|
9613
|
4854
|
|
First 10 months of 2010
|
113670
|
313
|
19006
|
9272
|
3846
|
|
Y-O-Y rise
|
16.5
|
50.8
|
15.3
|
3.7
|
26.2
|
| |
8<L≤9
|
7<L≤8
|
6<L≤7
|
5<L≤6
|
3.5<L≤5
|
|
First 10 months of 2011
|
14845
|
19287
|
20514
|
13809
|
27061
|
|
First 10 months of 2010
|
13369
|
18344
|
20420
|
18683
|
10417
|
|
Y-O-Y rise
|
11
|
5.14
|
0.46
|
-26.1
|
159.8
|

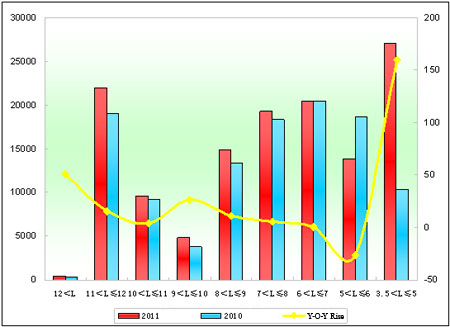
Chart 3: Seat Bus Sales Growth Chart of Different Lengths in the first 10 Months of 2011
We can see from the above that:
Seat bus sales increase 16.5% in the first 10 months of 2011, 2.2% more than the industrial average. From the lengths we can see that sales of every length increase except 5-6 meters, which means rural seat bus market is shrinking. Sales of 3.5-5 meters bus increase the most, then super large bus, and then 9-10 meters. The minimum growth is in 6-7 meters, then 7-8 meters. Apparently, seat bus is the major force of bus market growth in the first 10 months of 2011.
2. Zhengzhou Yutong Seat Buses
Table 4: Zhengzhou Yutong Seat Bus Sales Growth Table of Different Lengths in the first 10 Months of 2011
|
|
Total
|
12<L
|
11<L≤12
|
10<L≤11
|
|
First 10 months of 2011
|
25280
|
104
|
7070
|
2661
|
|
First 10 months of 2010
|
22520
|
100
|
5517
|
2435
|
|
Y-O-Y rise
|
12.3
|
4
|
28.1
|
9.3
|
|
Industry rise
|
16.5
|
50.8
|
15.3
|
3.7
|
| |
9<L≤10
|
8<L≤9
|
7<L≤8
|
6<L≤7
|
|
First 10 months of 2011
|
1994
|
5115
|
5817
|
2519
|
|
First 10 months of 2010
|
1534
|
4487
|
5362
|
3085
|
|
Y-O-Y rise
|
30.6
|
14
|
8.5
|
-18.3
|
|
Industry rise
|
26.2
|
11
|
5.14
|
0.46
|

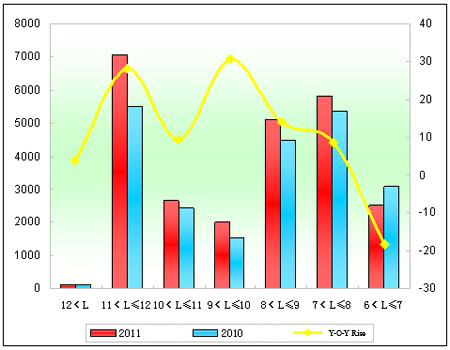
Chart 4: Zhengzhou Yutong Seat Bus Sales Growth Chart of Different Lengths in the first 10 Months of 2011
We can see from the above that:
(1) Sales of Yutong Seat Buses increase 12.3%, 4% less than industrial average, which is 12.2%, therefore, the sales growth of Yutong is due to city buses instead of seat buses.
(2) Analysis of growth tendency of every length: all lengths increase except 6-7 meters. Sales of 9-10 meters increase 30.6% and 11-12 meters increase 28.1%, more than the industrial average. Except super large bus and 6-7 meters bus, sales growth of other buses exceed the industrial average.
