Summarize:www.chinabuses.org:
2. King Long Seat Buses
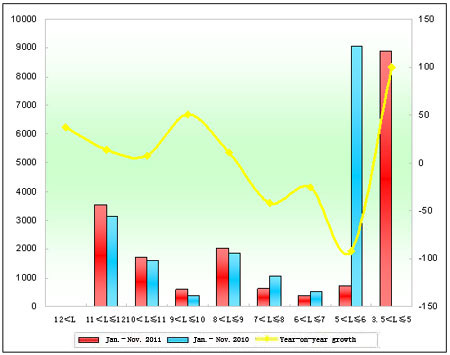
Table 4: Sales growth statistics of King Long Seat Buses in various lengths in Jan.-Nov. 2011
|
|
Total
|
12<L
|
11<L≤12
|
10<L≤11
|
9<L≤10
|
|
Jan.-Nov. 2011
|
18542
|
11
|
3553
|
1724
|
593
|
|
Jan.-Nov. 2010
|
17630
|
8
|
3131
|
1605
|
394
|
|
Year-on-year Growth
|
5.2
|
37.5
|
13.5
|
7.4
|
50.5
|
|
Industry Growth
|
15
|
32.3
|
19.3
|
4.5
|
19.9
|
| |
8<L≤9
|
7<L≤8
|
6<L≤7
|
5<L≤6
|
3.5<L≤5
|
|
Jan.-Nov. 2011
|
2042
|
617
|
397
|
728
|
8877
|
|
Jan.-Nov. 2010
|
1849
|
1061
|
532
|
9050
|
0
|
|
Year-on-year Growth
|
10.4
|
-41.8
|
-25.3
|
-91.9
|
100
|
|
Industry Growth
|
13
|
5.9
|
-2.4
|
-26.3
|
133
|

Chart 4: Sales growth statistics of King Long Seat Buses in various lengths in Jan.-Nov. 2011
From above data, it is seen that
①The sales of King Long seat buses increases by 5.2% in Jan.-Nov.2011 which is nearly 10 percentages lower than the growth rate of its overall sales growth and nearly 2 percentages lower than the growth rate of the general bus industry. It indicates that the sales growth of King Long seat buses is not the main factor to influence the overall sales growth of King Long Bus.
②It indicates that the sales growth of 3.5m-5m light buses is the main factor leading to the sales growth of King long seat buses.
Part three: Analysis of City Buses Sales Growth in Various Lengths in Jan.-Nov. 2011 and in Jan.-Nov.2010
1. The Sales Growth of City Buses in Various Lengths for the Bus Industry
Table 5: Sales Growth Statistics of City Buses in various lengths in Jan. - Nov.2011 and in Jan. - Nov.2010
|
|
Total
|
12<L
|
11<L≤12
|
10<L≤11
|
9<L≤10
|
|
Jan.-Nov. 2011
|
60412
|
2048
|
14017
|
13954
|
6152
|
|
Jan.-Nov. 2010
|
54270
|
869
|
12910
|
12462
|
6426
|
|
Year-on-year Growth
|
11.3
|
135.7
|
8.6
|
12
|
-4.3
|
| |
8<L≤9
|
7<L≤8
|
6<L≤7
|
5<L≤6
|
|
|
Jan.-Nov. 2011
|
8993
|
10299
|
3237
|
783
|
|
|
Jan.-Nov. 2010
|
8296
|
8706
|
2127
|
1721
|
|
|
Year-on-year Growth
|
8.4
|
18.3
|
52.2
|
-54.5
|
|

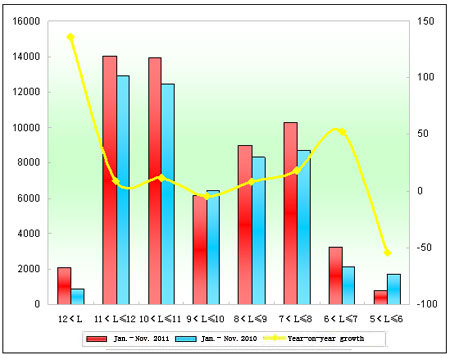
Chart 5: Sales Growth Statistics of City Buses in various lengths in Jan. - Nov.2011 and in Jan. - Nov.2010
From the above data, it is seen that
The sales growth of city buses increased by 11.3% in Jan.-Nov.2011 which was the eleventh month of city buses increasing since 2011 in the bus industry which indicates that the market of the city bus is also under the influence of Chinese economic which is one factor but not the main factor to push the sales of the bus market increasing in the first eleven months of 2011. Besides, the sales of buses at all lengths are in positive growth, the biggest increasing one is huge-type buses; the next one is 6m-7m intercity bus. But the sales growth of city buses is not so big which is smaller than the sales growth of the overall city sales growth.
2. King Long City Buses
Table 6: Sales Growth Statistics of King Long City Buses in various lengths in Jan.-Nov. 2011
|
|
Total
|
12<L
|
11<L≤12
|
10<L≤11
|
|
Jan.-Nov. 2011
|
3849
|
315
|
803
|
1407
|
|
Jan.-Nov. 2010
|
3315
|
44
|
737
|
1196
|
|
|
13.9
|
86
|
9
|
17.6
|
|
Industry Growth
|
11.3
|
135.7
|
8.6
|
12
|
| |
9<L≤10
|
8<L≤9
|
7<L≤8
|
|
|
Jan.-Nov. 2011
|
395
|
570
|
359
|
|
|
Jan.-Nov. 2010
|
250
|
714
|
374
|
|
|
|
58
|
-20.2
|
-4
|
|
|
Industry Growth
|
-4.3
|
8.4
|
18.3
|
|

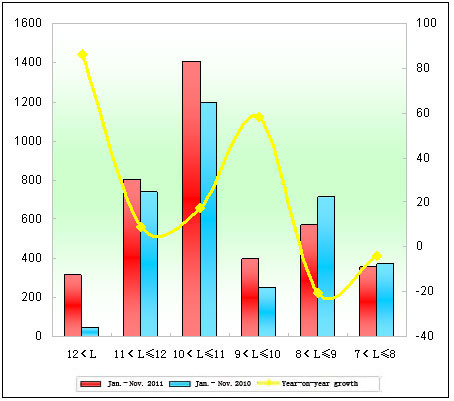
Chart 6: Sales Growth Statistics of King Long City Buses in various lengths in Jan.-Nov. 2011
From the above data, it is seen that
①The sales of King Long city buses increases by 13.9% while the industry increases by 11.3% in the first eleven months in 2011. The main growth shows at huge-type buses, 10m-11m, 11m-12m and 9m-10m buses. The main negative growth shows at 8m-9m and 7m-8m buses.
② The sales of King Long huge-type city buses increases 271 units while 44 units in Jan.-Nov.2010 and its sales growth is far more than the overall industry growth which is the main factor influences the King Long city buses increasing.
③ The sales growth of King Long city bus is bigger than that of King Long Seat Buses and overall buses industry market which shows that the sales growth of the city buses is the main factor to push the growth of the overall buses market.
