Summarize:www.chinabuses.org:II Seat Bus Sales Growth Analysis of Different Lengths in 2011
1. Industry Seat Bus Sales Growth Condition of Different Lengths
Table 3: Seat Bus Sales Growth Table of Different Lengths in 2011
|
|
Total
|
12<L
|
11<L≤12
|
10<L≤11
|
9<L≤10
|
|
2011
|
168413
|
500
|
29579
|
12153
|
6481
|
|
2010
|
144855
|
415
|
24657
|
11853
|
5147
|
|
Y-O-Y Rise
|
16.3
|
20.5
|
19.96
|
2.5
|
25.9
|
| |
8<L≤9
|
7<L≤8
|
6<L≤7
|
5<L≤6
|
3.5<L≤5
|
|
2011
|
19581
|
24775
|
25694
|
17642
|
32008
|
|
2010
|
17001
|
23206
|
26018
|
23168
|
13390
|
|
Y-O-Y Rise
|
15.2
|
6.8
|
-1.2
|
-23.9
|
139
|

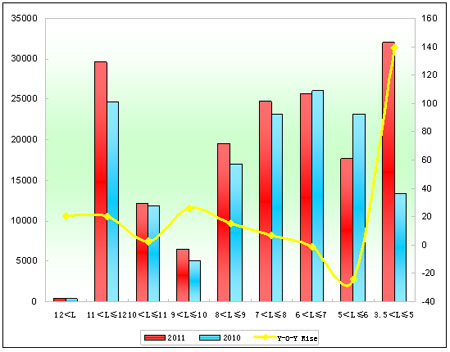
Chart 3: Seat Bus Sales Growth Chart of Different Lengths in 2011
We can see from the above that:
Seat bus sales increase 16.3% in 2011, 2% more than industrial average. From the lengths we can see that sales of every length increase except 5-6 meters and 6-7 meters. Sales of 3.5-5 meters bus increase the most, then super large bus.
2. Xiamen King Long Seat Buses
Table 4: Xiamen King Long Seat Bus Sales Growth Table of Different Lengths in 2011
|
|
Total
|
12<L
|
11<L≤12
|
10<L≤11
|
9<L≤10
|
|
2011
|
20671
|
11
|
4029
|
1954
|
673
|
|
2010
|
19632
|
8
|
3629
|
1820
|
440
|
|
Y-O-Y Rise
|
5.3
|
37.5
|
11
|
7.4
|
53
|
|
Industry Rise
|
16.3
|
20.5
|
19.96
|
2.5
|
25.9
|
| |
8<L≤9
|
7<L≤8
|
6<L≤7
|
5<L≤6
|
3.5<L≤5
|
|
2011
|
2460
|
748
|
421
|
846
|
9529
|
|
2010
|
2129
|
1157
|
641
|
9808
|
0
|
|
Y-O-Y Rise
|
15.5
|
-35.4
|
-34.3
|
-91.4
|
100
|
|
Industry Rise
|
15.2
|
6.8
|
-1.2
|
-23.9
|
139
|

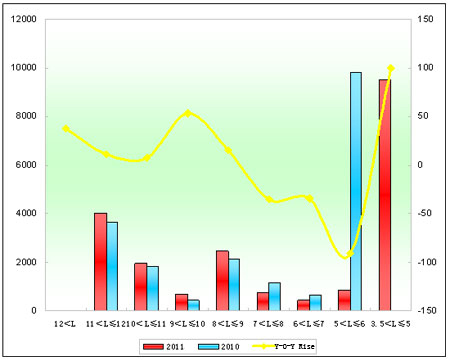
Table 4: Xiamen King Long Seat Bus Sales Growth Table of Different Lengths in 2011
We can see from the above that:
(1) Sales of King Long seat buses increase 5.3%, 11% more than industrial average which means growth of seat bus is not the main force of King Long.
(2) Sales of 3.5-5 meters seat buses increase the most, which makes up for the decreasing of 6-7 meters and 5-6 meters.
