Summarize:www.chinabuses.org:III City Bus Sales Growth Analysis of Different Lengths in 2011
1. Industry City Bus Sales Growth Condition of Different Lengths
Table 5: City Bus Sales Growth Table of Different Lengths in 2011
|
|
Total
|
12<L
|
11<L≤12
|
10<L≤11
|
9<L≤10
|
|
2011
|
69227
|
2096
|
16434
|
15708
|
6989
|
|
2010
|
62302
|
979
|
15026
|
14031
|
7599
|
|
Y-O-Y Rise
|
11.1
|
114.1
|
9.4
|
11.95
|
-8
|
| |
8<L≤9
|
7<L≤8
|
6<L≤7
|
5<L≤6
|
3.5<L≤5
|
|
2011
|
10646
|
11675
|
3752
|
928
|
999
|
|
2010
|
9274
|
10052
|
2522
|
1966
|
853
|
|
Y-O-Y Rise
|
14.8
|
16.1
|
48.8
|
-52.8
|
17.1
|

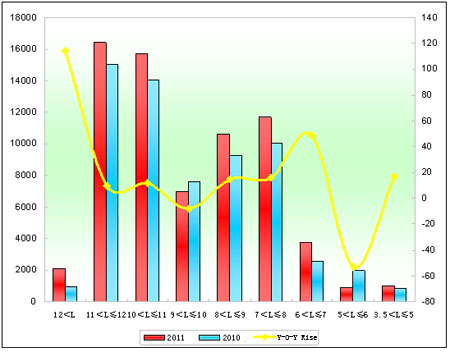
Chart 5: City Bus Sales Growth Chart of Different Lengths in 2011
We can see from the above that:
Sales of city buses increase by 11.1% in the first 12 months of 2011, which means national economic growth promotes city bus industry. From the lengths, except 5-6 meters and 9-10 meters, others are all positive growth.
2. Suzhou Higer City Buses
Table 6: Suzhou Higer City Bus Sales Growth Table of Different Lengths in 2011
|
|
Total
|
12<L
|
11<L≤12
|
10<L≤11
|
|
2011
|
6182
|
16
|
1804
|
1656
|
|
2010
|
5366
|
8
|
1152
|
1556
|
|
Y-O-Y Rise
|
15.2
|
100
|
56.6
|
6.4
|
|
Industry Rise
|
11.1
|
114.1
|
9.4
|
11.95
|
| |
9<L≤10
|
8<L≤9
|
7<L≤8
|
|
|
2011
|
802
|
975
|
929
|
|
|
2010
|
810
|
1174
|
666
|
|
|
Y-O-Y Rise
|
-0.99
|
-16.95
|
39.5
|
|
|
Industry Rise
|
-8
|
14.8
|
16.1
|
|

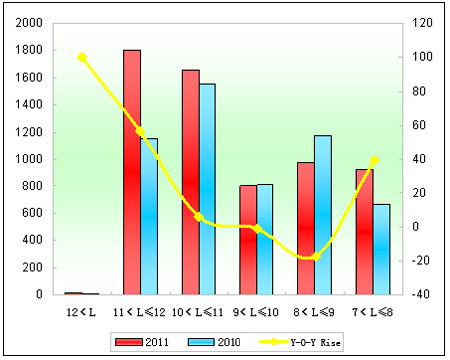
Chart 6: Suzhou Higer City Bus Sales Growth Chart of Different Lengths in 2011
We can see from the above that:
(1) Sales of Higer city buses are 6182 units in 2011, 816 units over 2010, up to 15.2%, 4% more than industrial average.
(2) Sale of 11-12 meters and 7-8 meters increase the most, up to 652 units and 263 units respectively, while 9-10 meters and 8-9 meters decrease.
(3) Sales of Higer city buses increase more than industrial average and its whole market growth, which means growth of city buses is the main reason to promote Higer whole market in 2011.
