Summarize:www.chinabuses.org:III City Bus Sales Growth Analysis of Different Lengths in January of 2012
1. Industry City Bus Sales Growth Condition of Different Lengths
Table 5: City Bus Sales Growth Table of Different Lengths in January of 2012
|
|
Total
|
12<L
|
11<L≤12
|
10<L≤11
|
9<L≤10
|
|
2012.1
|
4049
|
178
|
1041
|
994
|
532
|
|
2011.1
|
4920
|
67
|
1232
|
902
|
507
|
|
Y-O-Y Rise
|
-17.7
|
165.7
|
-15.5
|
10.2
|
4.9
|
| |
8<L≤9
|
7<L≤8
|
6<L≤7
|
5<L≤6
|
3.5<L≤5
|
|
2012.1
|
444
|
579
|
256
|
23
|
2
|
|
2011.1
|
731
|
1060
|
296
|
59
|
66
|
|
Y-O-Y Rise
|
-39.3
|
-45.4
|
-13.5
|
-61
|
-97
|

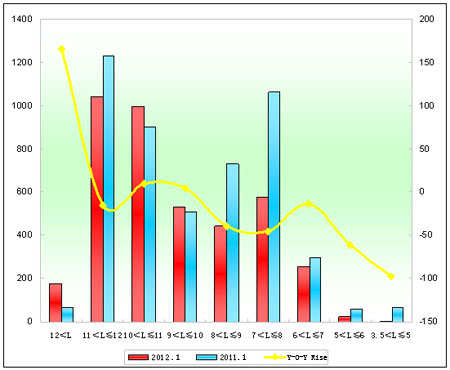
Chart 5: City Bus Sales Growth Chart of Different Lengths in January of 2012
We can see from the above that:
Sales of city buses in January of 2012 decrease 17.7%, less than seat buses. Sales of super large city buses, 10-11 meters and 9-10 meters increase.
2. Suzhou Higer City Buses
Table 6: Suzhou Higer City Bus Sales Growth Table of Different Lengths in January of 2012
|
|
Total
|
12<L
|
11<L≤12
|
10<L≤11
|
|
2012.1
|
290
|
0
|
97
|
107
|
|
2011.1
|
428
|
10
|
39
|
99
|
|
Y-O-Y Rise
|
-32.2
|
-100
|
148.7
|
8.1
|
|
Industry Rise
|
-17.7
|
165.7
|
-15.5
|
10.2
|
| |
9<L≤10
|
8<L≤9
|
7<L≤8
|
|
|
2012.1
|
43
|
24
|
19
|
|
|
2011.1
|
38
|
169
|
73
|
|
|
Y-O-Y Rise
|
13.1
|
-85.8
|
-74
|
|
|
Industry Rise
|
4.9
|
-39.3
|
-45.4
|
|

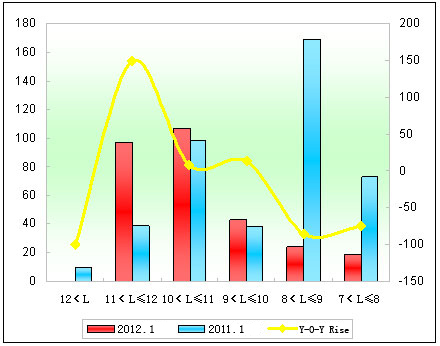
Chart 6: Suzhou Higer City Bus Sales Growth Chart of Different Lengths in January of 2012
We can see from the above that:
(1) Sales of Higer city buses in January are 290 units, 140 units less than those in January of 2011, up to 32.2%, which is the main reason to slow down the whole growth.
(2) Sales of 9-10 meters increase 12 units, up to 46.2%, while sales of other lengths decrease.
Higer city bus sales of 11-12 meters, 10-11 meters and 9-10 meters increase while sales of 7-8 meters and 8-9 meters decrease.
(3) Sales of super large city buses are 0, while 10 units in January of 2011.
