Summarize:www.chinabuses.org:I Bus Industry Sales Growth Analysis in January 2012
1. Overall Sales Growth Condition of Different Lengths
Table 1: Sales Growth Table of Different Lengths in January 2012
|
|
Total
|
12<L
|
11<L≤12
|
10<L≤11
|
9<L≤10
|
|
2012.1
|
17916
|
959
|
2870
|
1860
|
957
|
|
2011.1
|
23348
|
165
|
5229
|
2036
|
1128
|
|
Y-O-Y Rise
|
-23.3
|
481.2
|
-45.1
|
-8.6
|
-15.2
|
| |
8<L≤9
|
7<L≤8
|
6<L≤7
|
5<L≤6
|
3.5<L≤5
|
|
2012.1
|
2153
|
2692
|
2181
|
1218
|
3026
|
|
2011.1
|
2738
|
3344
|
2350
|
1896
|
4462
|
|
Y-O-Y Rise
|
-21.3
|
-19.5
|
-7.2
|
-35.8
|
-32.2
|

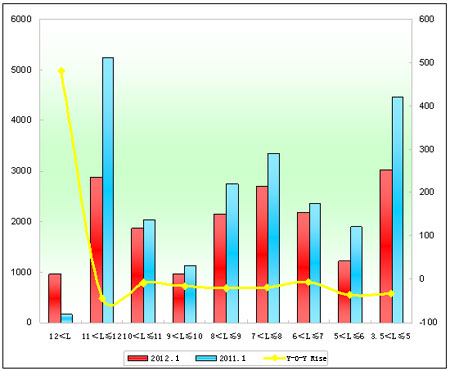
Chart 1: Sales Growth Chart of Different Lengths in January 2012
We can see from the above that:
Overall sales in January 2012 decrease 23.3% over 2011. Sales of every length decrease except super large buses. Sales of 11-12 meters decrease the most, then 5-6 meters, while sale of super large buses increase 481.2%. The decrease is mainly due to long spring festival holidays.
2. Xiamen King Long Sales Growth Analysis of Different Lengths
Table 2: Xiamen King Long Sales Growth Table of Different Lengths in January 2012
|
|
Total
|
12<L
|
11<L≤12
|
10<L≤11
|
9<L≤10
|
|
2012.1
|
1436
|
0
|
163
|
89
|
8
|
|
2011.1
|
2343
|
2
|
368
|
269
|
57
|
|
Y-O-Y Rise
|
-38.7
|
-100
|
-55.7
|
-66.9
|
-85.96
|
|
Industry Rise
|
-23.3
|
481.2
|
-45.1
|
-8.6
|
-15.2
|
| |
8<L≤9
|
7<L≤8
|
6<L≤7
|
5<L≤6
|
3.5<L≤5
|
|
2012.1
|
141
|
40
|
99
|
48
|
848
|
|
2011.1
|
294
|
150
|
144
|
127
|
932
|
|
Y-O-Y Rise
|
-52
|
-73.3
|
-31.2
|
-62.2
|
-9
|
|
Industry Rise
|
-21.3
|
-19.5
|
-7.2
|
-35.8
|
-32.2
|

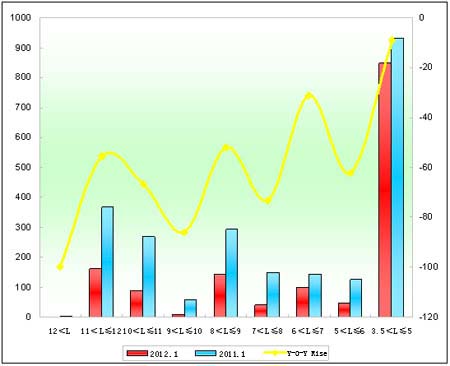
Chart 2: Xiamen King Long Sales Growth Chart of Different Lengths in January 2012
We can see from the above that:
(1) Sales of Xiamen Golden Dragon in January 2012 decrease 38.7% over last year, 15.4% more than industrial average, which means sales of Golden Dragon decrease the most.
(2) Sales of each length decrease, especially 11-12 meters.
(3) Product structure of Xiamen Golden Dragon is not rational that sales of below-8-meter account for 72%, more than that in January 2011.
