Summarize:www.chinabuses.org:III City Bus Sales Growth Analysis of Different Lengths in the first two months of 2012
1. Industry City Bus Sales Growth Condition of Different Lengths
Table 5: City Bus Sales Growth Table of Different Lengths in the first two months of 2012
|
|
Total
|
12<L
|
11<L≤12
|
10<L≤11
|
9<L≤10
|
|
First Two Months of 2012
|
7508
|
376
|
2199
|
1687
|
821
|
|
First Two Months of 2011
|
7046
|
163
|
1912
|
1489
|
733
|
|
Y-O-Y Rise
|
6.6
|
130.7
|
15
|
13.3
|
12
|
| |
8<L≤9
|
7<L≤8
|
6<L≤7
|
5<L≤6
|
3.5<L≤5
|
|
First Two Months of 2012
|
933
|
1028
|
423
|
35
|
6
|
|
First Two Months of 2011
|
827
|
1389
|
383
|
60
|
90
|
|
Y-O-Y Rise
|
12.8
|
-25.99
|
10.4
|
-41.7
|
-93.3
|

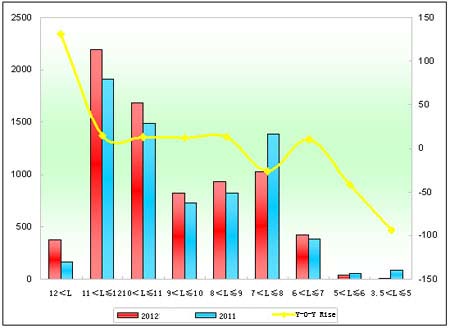
Chart 5: City Bus Sales Growth Chart of Different Lengths in the first two months of 2012
We can see from the above that:
Sales of city buses in the first two months of 2012 increase 6.6%, which means city bus market starts to bloom. From the lengths, sales of over 9 meters increase while below 9 meters, except 6m-7m, sale of other lengths decrease.
2. Xiamen King Long City Buses
Table 6: Xiamen King Long City Bus Sales Growth Table of Different Lengths in the first two months of 2012
|
|
Total
|
12<L
|
11<L≤12
|
10<L≤11
|
|
First Two Months of 2012
|
540
|
5
|
166
|
139
|
|
First Two Months of 2011
|
624
|
25
|
264
|
207
|
|
Y-O-Y Rise
|
-13.5
|
-80
|
-37.1
|
-32.9
|
|
Industry Rise
|
6.6
|
130.7
|
15
|
13.3
|
| |
9<L≤10
|
8<L≤9
|
7<L≤8
|
|
|
First Two Months of 2012
|
63
|
160
|
7
|
|
|
First Two Months of 2011
|
96
|
19
|
13
|
|
|
Y-O-Y Rise
|
-34.3
|
742.1
|
-46.2
|
|
|
Industry Rise
|
12
|
12.8
|
-25.99
|
|

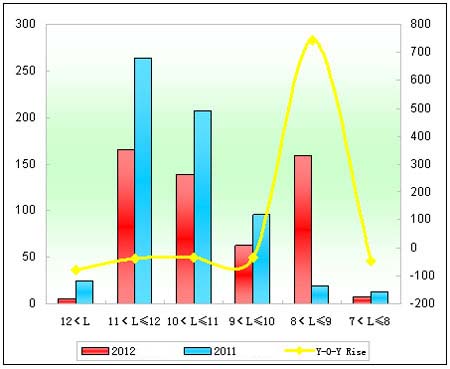
Chart 6: Xiamen King Long City Bus Sales Growth Chart of Different Lengths in the first two months of 2012
We can see from the above that:
(1) Sales of King Long city buses in the first two months decrease 13.5%, 20% more than industrial average.
(2) From the lengths, except 8m-9m, sales of other lengths decrease.
(3) Compared with seat buses, King Long city buses hinder its overall increase, with over ten percent decrease.
